Statistical testing
![]()
![]()
Summary: this tutorial explains how to perform various statistical tests with FSharp.Stats.
FSharp.Stats provides hypothesis tests for different applications. A hypothesis test is a statistical test that is used to determine whether there is enough evidence in a sample of data to infer that a certain condition is true for the entire population. A hypothesis test examines two opposing hypotheses about a population: the null hypothesis and the alternative hypothesis.
Test Statistics
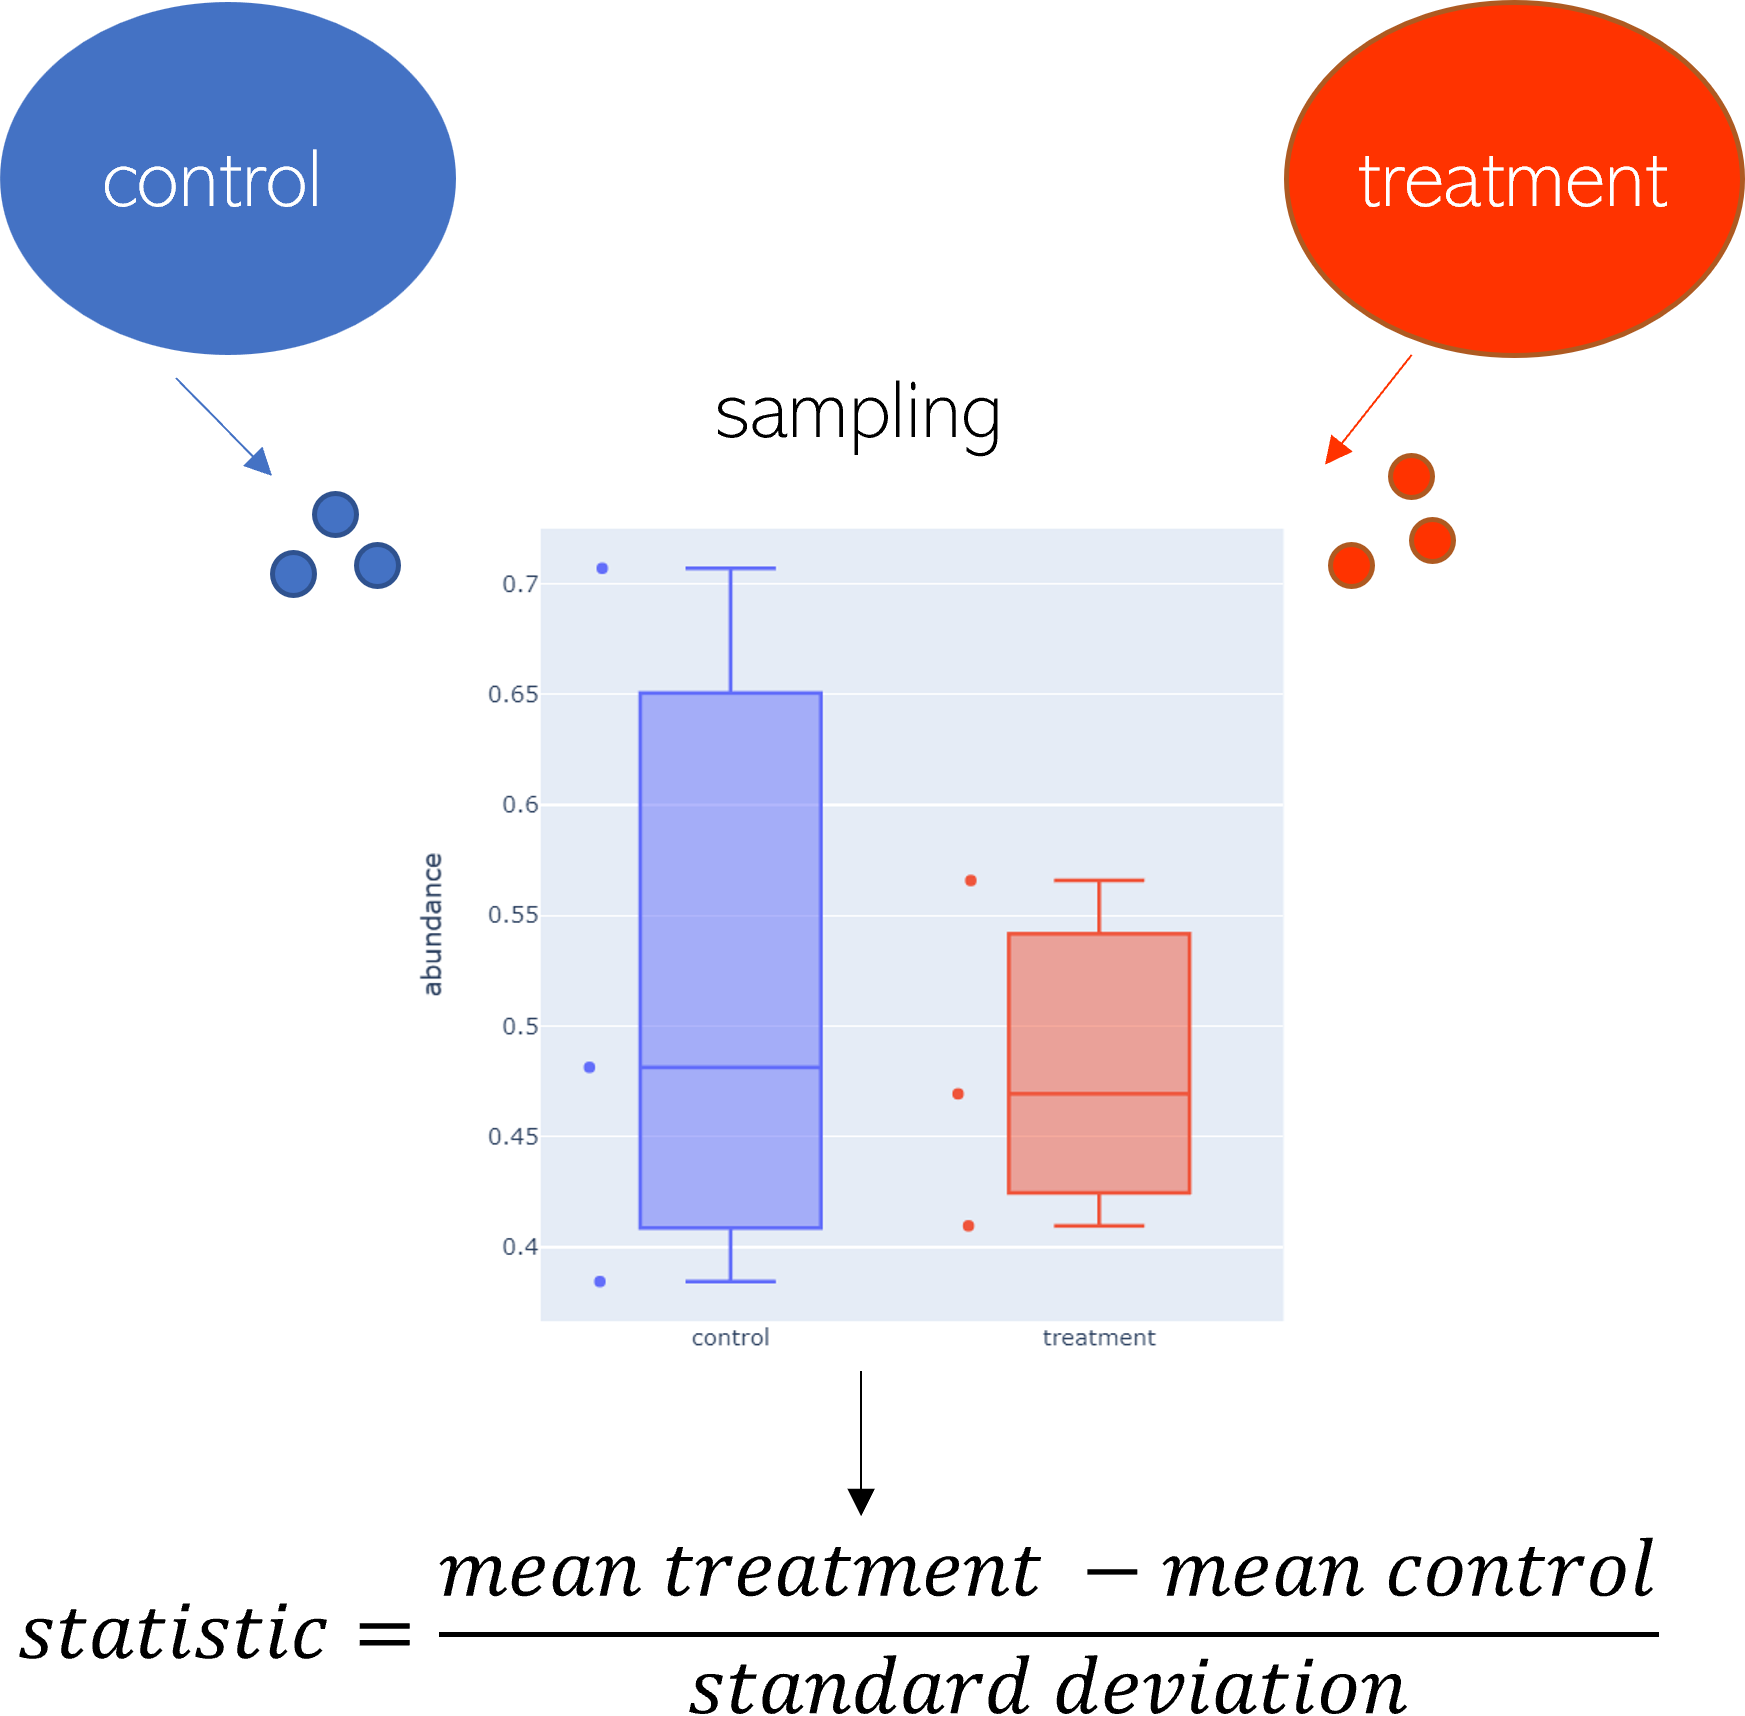
T-Test
By using a t test a difference of means can be evaluated. There are different kinds of t test designs implemented in FSharp.Stats.
-
One sample t test:
- Is the population mean equal to the value of H0?
- e.g. “Is my grade different from the distribution mean?”
-
Two sample t test with equal variances:
- Prerequisite: equal variances
- Is the mean of Population A equal to the mean of Population B?
-
2.1 unpaired t test:
- e.g.: Does the cell size differ between wildtype and mutant?
-
2.2 paired t test:
- e.g.: Does the medication influence the blood pressure? Measurement of the same persons before and after medication.
-
Two sample t test with unequal variances
- Welch test (unpaired)
Case 1: One sample t test
open FSharp.Stats
open FSharp.Stats.Testing

let sampleA = vector [|4.5; 5.1; 4.8; 4.4; 5.0|]

// calculates a one sample t test with a given sample and the fixed value the sample should be compared with
let oneSampleTTest = TTest.oneSample sampleA 5.

(*
    The test returns no significant p value:
    oneSampleTTest.PValue = 0.1533
*)
Case 2: Two sample t test with equal variances (unpaired)
A standard two sample t test expects the samples to be taken from populations with equal standard deviations. Violations of this requirement result in an inflated false positive rate.
let sample1 = vector [|4.9;5.0;6.7;4.8;5.2|]
let sample2 = vector [|3.9;4.9;3.8;4.5;4.5|]

let twoSampleTTest = TTest.twoSample true sample1 sample2

(*
    The test returns a significant p value:
    twoSampleTTest.PValue = 0.0396
*)
Case 3: Two sample t test with equal variances (paired)
A paired t-test is used to compare two population means where you have two samples in which observations in one sample can be paired with observations in the other sample. Examples of where this might occur are:
- Before-and-after observations on the same subjects (e.g. students’ diagnostic test results before and after a particular module or course).
- A comparison of two different methods of measurement or two different treatments where the measurements/treatments are applied to the same subjects (e.g. blood pressure measurements using a stethoscope and a dynamap).
let sampleP1 = vector [18.;21.;16.;22.;19.;24.;17.;21.;23.;18.;14.;16.;16.;19.;18.;20.;12.;22.;15.;17.;]
let sampleP2 = vector [22.;25.;17.;24.;16.;29.;20.;23.;19.;20.;15.;15.;18.;26.;18.;24.;18.;25.;19.;16.;]

let paired = TTest.twoSamplePaired sampleP1 sampleP2

(*
    The test returns a significant p value:
    paired.PValue = 0.00439
*)
Case 4: Two sample t test with unequal variances (Welch test)
If you are unsure about the nature of the underlying population, you may ask if the theoretical population distributions you want to compare do have the same standard deviations.
If not the welch test can serve as an appropriate hypothesis test for mean differences.
let sampleW1 = vector [0.8;0.9;1.0;1.1;1.2]
let sampleW2 = vector [0.8;1.1;1.3;1.5;2.0]

let welch = TTest.twoSample false sampleW1 sampleW2

(*
    The test returns a not significant p value:
    welch.PValue = 0.1725626595
*)
Anova
let dataOneWay =
    [|
    [|0.28551035; 0.338524035; 0.088313218; 0.205930807; 0.363240102;|];
    [|0.52173913; 0.763358779; 0.32546786; 0.425305688; 0.378071834; |];
    [|0.989119683; 1.192718142; 0.788288288; 0.549176236; 0.544588155;|];
    [|1.26705653; 1.625320787; 1.266108976; 1.154187629; 1.268498943; 1.069518717;|];
    |]

let contrastMatrix =
    [|
    [|1.0;-1.0;0.0;0.0;|]
    [|1.0;0.0;-1.0;0.0;|]
    [|1.0;0.0;0.0;-1.0;|]
    [|0.0;1.0;-1.0;0.0;|]
    [|0.0;1.0;0.0;-1.0;|]
    [|0.0;0.0;1.0;-1.0;|]
    |]

let oneWayResult = Anova.oneWayAnova dataOneWay
|
(*
anovaResult.Factor.Statistic = 27.594
The factor statistic indicates how much more variability there is between the the samples
than within the samples.
anovaResult.Factor.PValue = 9.257958872e-07
A strong significant p value in the factor field indicates that one or more means differ from each other
*)
// http://astatsa.com/OneWay_Anova_with_TukeyHSD/
// https://www.wessa.net/rwasp_Two%20Factor%20ANOVA.wasp

let data =
    [
        (0.28, 'A', 'M');
        (0.95, 'A', 'M');
        (0.96, 'A', 'M');
        (0.97, 'A', 'M');
        (0.40, 'A', 'M');
        (0.18, 'A', 'M');
        (0.12, 'A', 'M');
        (0.62, 'A', 'M');
        (1.81, 'A', 'F');
        (1.51, 'A', 'F');
        (1.41, 'A', 'F');
        (1.39, 'A', 'F');
        (1.20, 'A', 'F');
        (1.55, 'A', 'F');
        (1.48, 'A', 'F');
        (1.25, 'A', 'F');
        (0.95, 'B', 'M');
        (1.33, 'B', 'M');
        (0.92, 'B', 'M');
        (0.85, 'B', 'M');
        (1.06, 'B', 'M');
        (0.69, 'B', 'M');
        (0.70, 'B', 'M');
        (0.79, 'B', 'M');
        (2.93, 'B', 'F');
        (3.24, 'B', 'F');
        (3.42, 'B', 'F');
        (2.79, 'B', 'F');
        (2.54, 'B', 'F');
        (3.28, 'B', 'F');
        (2.80, 'B', 'F');
        (3.40, 'B', 'F');
    ]
    //f1
    |> Seq.groupBy (fun (v,f1,f2) -> f1)
    //f2
    |> Seq.map (fun (k,vls) ->
        vls
        |> Seq.groupBy (fun (v,f1,f2) -> f2)
        |> Seq.map (fun (k,vls') -> vls' |> Seq.map (fun (v,f1,f2) -> v) |> Seq.toArray)
        |> Seq.toArray
        )
    |> Seq.toArray


Anova.twoWayANOVA Anova.TwoWayAnovaModel.Mixed data

// http://statweb.stanford.edu/~susan/courses/s141/exanova.pdf
// http://scistatcalc.blogspot.de/2013/11/two-factor-anova-test-calculator.html#

let data' =
    [|
      // super
        // cold super
      [|[|4.;5.;6.;5.;|];
        // warm super
        [|7.;9.;8.;12.;|];
        // hot super
        [|10.;12.;11.;9.; |]|];
      // best
        // cold best
      [|[|6.;6.;4.;4.;|];
        // warm best
        [|13.;15.;12.;12.;|];
        // hot best
        [|12.;13.;10.;13.;|]|]
    |]

Anova.twoWayANOVA Anova.TwoWayAnovaModel.Mixed data'
F-Test
The F-test is a method to determine if the variances of two samples are homogeneous. Also, ANOVA (analysis of variance) is based on the F-test and is used for the comparison of more than two samples. Knowing if your variances are equal (H0 is true) helps to decide which test should be performed next. To determine if your variances are in fact equal you can perform a F-test.
Prerequisites:
- population distributions are normally distributed
- samples are independent
Possible further tests:
- two sample t-test with equal variances
- two sample t-test with unequal variances (Welch-test)
- ...
Note that there is no information about the direction of variance difference (e.g. Zimmermann 2004). In this implemented test the larger variance is always the numerator, therefore the comparison to Fdf1,df2,1-(alpha/2) is used for a two sided test.
Important note: The effectiveness of a preliminary test of variances is discussed. The F-test is extremely sensitive to normality-violations, and even if the samples follow a normal distribution, it often does not detect situations where a t-test should be avoided.
References:
- Jürgen Bortz & Christof Schuster, Statistik für Human- und Sozialwissenschaftler (2010) Chapter 8.6
- Markowski, Conditions for the Effectiveness of a Preliminary Test of Variance (1990)
- Shlomo S. Sawilowsky, The Probable Difference Between Two Means When σ12≠σ22 (2002)
- Ronald Ley, F curves have two tails but the F test is a one-tailed two-tailed test (1979) + Reviewer comments
- Donald W. Zimmermann, A note on preliminary tests of equality of variances (2004)
F-Test from data:
let sampleFA = vector [|5.0; 6.0; 5.8; 5.7|]
let sampleFB = vector [|3.5; 3.7; 4.0; 3.3; 3.6|]

// comparison of sample variances
let fTestFromData = FTest.testVariances sampleFA sampleFB
(*
    { Statistic = 2.823383085
    DegreesOfFreedom1 = 3.0
    DegreesOfFreedom2 = 4.0
    PValue = 0.1708599931 }
    Using a significance level of 0.05 the sample variances do differ significantly.

*F-Test from given parameters:*
*)

// sample properties are given as (variance,degree of freedom)
let sampleF1 = (0.1, 15.)
let sampleF2 = (0.05, 7.)

// comparison of sample variances
let fTestFromParameters = FTest.testVariancesFromVarAndDof sampleF1 sampleF2
|
Using a significance level of 0.05 the sample variances do differ significantly.
H-Test
The H-test is also known as Kruskal-Wallis one-way analysis-of-variance-by-ranks and is the non-parametric equivalent of one-way ANOVA. It is a non-parametric test for comparing the means of more than two independent samples (equal or different sample size), and therefore is an extension of Wilcoxon-Mann-Whitney two sample test. Testing with H test gives information whether the samples are from the same distribution.
A benefit of the H-test is that it does not require normal distribution of the samples. The downside is that there is no information which samples are different from each other, or how many differences occur. For further investigation a post hoc test is recommended.
The distribution of the H-test statistic is approximated by chi-square distribution with degrees of freedom = sample count - 1.
The implemented H-test is testing for duplicate values in the data. Duplicates lead to ties in the ranking, and are corrected by using a correction factor.
Prerequisites:
- random and independent samples
- observations are from populations with same shape of distribution
- nominal scale, ordinal scale, ratio scale or interval scale data
References:
- E. Ostertagová, Methodology and Application of the Kruskal-Wallis Test (2014)
- Y. Chan, RP Walmsley, Learning and understanding the Kruskal-Wallis one-way analysis-of-variance-by-ranks test for differences among three or more independent groups (1997)
let groupA = [44.;44.;54.;32.;21.;28.]
let groupB = [70.;77.;48.;64.;71.;75.]
let groupC = [80.;76.;34.;80.;73.;80.]
let samples = [groupA;groupB;groupC]

// calculation of the H-test
let hResult = HTest.createHTest samples
|
PValueRight is significant at a alpha level of 0.05
A suitable post hoc test for H-tests is Dunn's test.
Friedman-Test
The Friedman-Test is a nonparametric method to detect differences in more than two related samples. It's used for dependent samples, e.g. with measurements of different treatments or at different timepoints. The test can be performed even on small sample sizes. One benefit of the implemented version in FSharp.Stats is that a correction factor is applied if there are any ties in the measurements.
Requirements:
- sample sizes must be identical
- repeated measurements
- no need for normal distribution of the samples
- samples must be at least ordinal scaled
The idea of the test is to rank each value in every ID (as seen below). The test statistic approximately follows a chi-squared distribution (dof = k-1). The recommended Post-Hoc-Test is Wilcoxon-signed-rank-test or a Bonferroni-correction. Example taken from Universitaet Zuerich - Methodenberatung Friedman-Test ( https://www.methodenberatung.uzh.ch/de/datenanalyse_spss/unterschiede/zentral/friedman.html ) with a modification for 3 ties in one ID.
References:
- Viv Bewick, Liz Cheek & Jonathan Ball, Statistics review 10: Further nonparametric methods (2004)
- Salvador García, Alberto Fernández, Julián Luengo, Francisco Herrera, Advanced nonparametric tests for multiple comparisons in the design of experiments in computational intelligence and data mining: Experimental analysis of power (2010)
ID   |  pre   | month 1| month 2| month 3| month 4
1       275     273      288      273      273

2       292     283      284      285      329

3       281     274      298      270      252

4       284     275      271      272      258

5       285     294      307      278      275
6       283     279      301      276      279
7       290     265      298      291      295
8       294     277      295      290      271
9       300     304      293      279      271
10      284     297      284      292      284
Ranking the results - average if values appear multiple times in one ID
ID   |  pre   | month 1| month 2| month 3| month 4
1       4       2        5        2        2
2       4       1        2        3        5
3       4       3        5        2        1
4       5       4        2        3        1
5       3       4        5        2        1
6       4       2.5      5        1        2.5
7       2       1        5        3        4
8       4       2        5        3        1
9       4       5        3        2        1
10      2       5        2        4        2
rank-sums
        36      29.5     39       25       20.5
// The data have to be entered in this format:

let A = [|275.;273.;288.;273.;273.|]
let B = [|292.;283.;284.;285.;329.|]
let C = [|281.;274.;298.;270.;252.|]
let D = [|284.;275.;271.;272.;258.|]
let E = [|285.;294.;307.;278.;275.|]
let F = [|283.;279.;301.;276.;279.|]
let G = [|290.;265.;298.;291.;295.|]
let H = [|294.;277.;295.;290.;271.|]
let I = [|300.;304.;293.;279.;271.|]
let J = [|284.;297.;284.;292.;284.|]

// add everything in one sequence
let samplesMany =  [|A;B;C;D;E;F;G;H;I;J|]

// create the test
let friedmanResult = FriedmanTest.createFriedmanTest samplesMany

// results
|
Wilcoxon-Test
The Wilcoxon signed-rank test is a non-parametric alternative to the paired t-test. The test is used to determine if two samples stem from a similar distributed population. It calculates the differences between sets of pairs and ranks them to analyze if they are statistically significantly different. If at least one of the assumptions for the t-test is not given the Wilcoxon signed-rank test can be used. This implemented test uses a normal distribution approximation (validated against SciPy with mode="approx"). It also includes automatic tie correction as well as optional continuity correction.
Cases where Wilcoxon signed-rank test can be used:
- Compare 2 dependent samples
- Repeated measurements on single samples
- Matched samples
Assumptions for the test:
- Data are paired and from the same population
- Each pair is chosen randomly and independently
- At least interval scaled data
let before = [78.;24.;64.;45.;64.;52.;30.;50.;64.;50.;78.;22.;84.;40.;90.;72.]
let after  = [78.;24.;62.;48.;68.;56.;25.;44.;56.;40.;68.;36.;68.;20.;58.;32.]

// create the test
// Results with continuity correction:
let wilcoxonResult = WilcoxonTest.createWilcoxonTest before after true
// results
|
// Results without continuity correction:
let wilcoxonResult2 = WilcoxonTest.createWilcoxonTest before after false
// results
|
//alternatively you can use just the differences
let differences = [0.;0.;2.;-3.;-4.;-4.;5.;6.;8.;10.;10.;-14.;16.;20.;32.;40.]
// results from differences
let wilcoxonResult3 = WilcoxonTest.createWilcoxonTestFromDifferences differences true
// results
|
References:
- Concepts & Applications of Inferential Statistics - VassarStats
- Wilcoxon Test, Adam Hayes, 13 April 2020, accessed 20.09.2021
Chi-Squared Test
WIP
Bartlett
WIP
PostHoc
ANOVA provides the user with a global statement if samples differ from each other. It does not provide detailed information regarding differences of the single samples.
If the H0 hypothesis is neglected (so significant differences are assumed), a post hoc test (multiple comparison test) allows the pairwise comparison of the individual groups.
Reference: What is the proper way to apply the multiple comparison test?, Sangseok Lee and Dong Kyu Lee, 2018
Fisher's LSD
The simplest method is Fisher's least significant difference (Fisher's LSD). It calculates Student's t tests for all pairwise comparisons. But instead of estimating the variance for each sample separately it takes all groups into account. Violations of the homogeneity of variances reduce the test power. Since no correction for multiple comparisons is performed, the resulting p values must be corrected (for example with Benjamini-Hochberg method).
Important: Fishers LSD is dependent to a significant ANOVA (ANOVA-protected post-hoc test).
open PostHoc

let lsd = Testing.PostHoc.fishersLSD contrastMatrix dataOneWay

// For multi comparison correction, the p values are adjusted by the Benjamini-Hochberg approach
let (index,pValue,pValueAdj) =
    lsd
    |> Testing.MultipleTesting.benjaminiHochbergFDRBy (fun x -> x,x.Significance)
    |> List.sortBy (fun (x,_) -> x.Index)
    |> List.map (fun (x,pValAdj) -> x.Index, x.Significance, pValAdj)
    |> List.unzip3

let lsdCorrected =
    let header = ["<b>Contrast index</b>";"<b>p Value</b>";"<b>p Value adj</b>"]
    let rows =
        [
            [sprintf "%i" index.[0];sprintf "%.6f" pValue.[0];sprintf "%.6f" pValueAdj.[0];]
            [sprintf "%i" index.[1];sprintf "%.6f" pValue.[1];sprintf "%.6f" pValueAdj.[1];]
            [sprintf "%i" index.[2];sprintf "%.6f" pValue.[2];sprintf "%.6f" pValueAdj.[2];]
            [sprintf "%i" index.[3];sprintf "%.6f" pValue.[3];sprintf "%.6f" pValueAdj.[3];]
            [sprintf "%i" index.[4];sprintf "%.6f" pValue.[4];sprintf "%.6f" pValueAdj.[4];]
            [sprintf "%i" index.[5];sprintf "%.6f" pValue.[5];sprintf "%.6f" pValueAdj.[5];]
        ]

    Chart.Table(
        header,
        rows,
        HeaderFillColor = Color.fromHex "#45546a",
        CellsFillColor = Color.fromColors [Color.fromHex "#deebf7";Color.fromString "lightgrey"]
        )
|
Hays
Testing.PostHoc.hays contrastMatrix dataOneWay


//let m1 = Seq.mean dataOneWay.[0]
//let m2 = Seq.mean dataOneWay.[1]

//let s1 = Seq.sum dataOneWay.[0]
//let s2 = Seq.sum dataOneWay.[1]
//let s3 = Seq.sum dataOneWay.[2]


//let d = (m1-m2)**2.0
//d / (3.926003843 * (1./5. + 1./5.))

// http://www.statisticslectures.com/topics/posthoconewayanova/
let dmg =
    [|
     [|9.;8.;7.;8.;8.;9.;8.;|];
     [|7.;6.;6.;7.;8.;7.;6.;|];
     [|4.;3.;2.;3.;4.;3.;2.;|] ;
    |]

let contrastMatrixDmg =
    [|
     [|1.0;-1.0;0.0;|] ;
     [|1.0;0.0;-1.0;|] ;
     [|0.0;1.0;-1.0;|]
    |]


Testing.PostHoc.hays contrastMatrixDmg dmg

Anova.oneWayAnova dmg
Tukey HSD
Tukeys honestly significant difference (HSD) can be used to inspect a significant ANOVA result for underlying causes.
Important note: Various discussions question the application of Tukeys HSD only to significant ANOVA results (Anova-protected post-hoc test), since Tukeys HSD already controls for multiple testing. Inform yourself prior to using an post hoc test appropriate to your experimental design. Fishers LSD however is dependent to a significant ANOVA.
Using this post hoc test you can determine which of the means differ significantly from each other. In the classis Tukeys HSD approach, the population variances are pooled for a more robust estimation (especially with small sample sizes). If the population variances differ, Tukeys HSD is not appropriate.
The implemented Tukey-Kramer-Method can be applied on unequal sample sizes and estimates the variance based on the means to compare. The Tukey-Kramer method can be used as stand-alone method for comparing multiple means.
A comparison of ANOVA and Tukey-Kramer-HSD with simulations for the robustness of normality-violations of the data can be found in:
Robustness of the ANOVA and Tukey-Kramer Statistical Tests, Wade C. Driscoll, Computers ind. Engng Vol 31, No. 1/2, pp. 265 - 268, 1996
Multiple-to-one comparisons can alternatively performed with Dunnet's test, which was designed for performing k-1 tests, while Tukeys HSD performs k((k-1)/2) tests.
Task: It should be tested if one or more means of samples taken from different mutants differ from each other.
// Example values from: https://brownmath.com/stat/anova1.htm
let hsdExample =
    [|
        [|64.; 72.; 68.; 77.; 56.; 95.;|] // sample of mutant/drug/factor 1
        [|78.; 91.; 97.; 82.; 85.; 77.;|] // sample of mutant/drug/factor 2
        [|75.; 93.; 78.; 71.; 63.; 76.;|] // sample of mutant/drug/factor 3
        [|55.; 66.; 49.; 64.; 70.; 68.;|] // sample of mutant/drug/factor 4
    |]

let anovaResult = Anova.oneWayAnova hsdExample

(*
    anovaResult.Factor.Statistic = 5.41
    The factor statistic indicates how much more variability there is between the the samples
    than within the samples.
    anovaResult.Factor.PValue = 0.0069
    A significant p value in the factor field indicates that one or more means differ from each other
*)
For tukey HSD calculations you need a contrast matrix, that defines the groups you want to compare for more detailed information.
Every contrast has as many entries as there are groups (samples). The groups, that should be compared are labelled with -1 or 1 respectively.
// In this contrast matrix every possible scenario is covered.
let contrastMatrixHSD =
    [|
    [|1.;-1.; 0.; 0.;|] // sample 1 is compared to sample 2
    [|1.; 0.;-1.; 0.;|] // sample 1 is compared to sample 3
    [|1.; 0.; 0.;-1.;|]
    [|0.; 1.;-1.; 0.;|]
    [|0.; 1.; 0.;-1.;|]
    [|0.; 0.; 1.;-1.;|] // sample 3 is compared to sample 4
    |]

let hsdResult = tukeyHSD contrastMatrixHSD hsdExample
|
(*
    For every generated contrast an output p value is calculated.
    e.g.
    hsdResult.[0].Significance = 0.0364
    hsdResult.[1].Significance = 0.4983
    hsdResult.[2].Significance = 0.1001
    hsdResult.[3].Significance = 0.1364
    hsdResult.[4].Significance = 0.0008
    hsdResult.[5].Significance = 0.0255
*)

//TTest.twoSample true (vector hsdExample.[0]) (vector hsdExample.[1])
//TTest.twoSample true (vector hsdExample.[0]) (vector hsdExample.[2])
//TTest.twoSample true (vector hsdExample.[0]) (vector hsdExample.[3])
//TTest.twoSample true (vector hsdExample.[1]) (vector hsdExample.[2])
//TTest.twoSample true (vector hsdExample.[1]) (vector hsdExample.[3])
//TTest.twoSample true (vector hsdExample.[2]) (vector hsdExample.[3])
Dunnett's (t) test
When there is one control group which should be compared with all treatment-groups, Tukeys HSD would lead to an explosion of comparisons if the number of conditions increases. If just the comparison of each treatment to an control is required you can use Dunnett's test. It is a multiple-to-one post hoc test for homoscedastic samples with equal variance that has a higher power than Tukey's HSD since fewer comparisons have to be performed, and therefore the Confidence limits are wider than necessary. "ANOVA is not a necessary part of the multiple comparisons procedure" (Dunnett, 1964).
Note: Dunnett's test is designed for equal group sizes and will only provide approximate values when group sizes differ (Dunnett 1955).
Reference:
- A Multiple Comparison Procedure for Comparing Several Treatments with a Control; CW Dunnett; Journal of the American Statistical Association; Dec. 1955
- New Tables for Multiple Comparisons with a Control; CW Dunnett; Biometrics; Sep. 1964
let dunnetExample =
    [|
        [|1.84;2.49;1.50;2.42;|]
        [|2.43;1.85;2.42;2.73;|]
        [|3.95;3.67;3.23;2.31;|]
        [|3.21;3.20;2.32;3.30;|]
        //only gives aproximate results when group sizes are unequal
        [|3.21;3.13;2.32;3.30;3.20;2.42;|]
    |]

//first sample serves as control
let dunnetContrastMatrix =
    [|
        [|-1.;1.;0.;0.;0.|]
        [|-1.;0.;1.;0.;0.|]
        [|-1.;0.;0.;1.;0.|]
        [|-1.;0.;0.;0.;1.|]
    |]

let dunnettResult =
    PostHoc.dunnetts dunnetContrastMatrix dunnetExample Tables.dunnettsTwoSided095
|
Fisher Hotelling
let d1 = [159.;179.;100.;45.;384.;230.;100.;320.;80.;220.;320.;210.;]
let d2 = [14.4;15.2;11.3;2.5;22.7;14.9;1.41;15.81;4.19;15.39;17.25;9.52; ]

Testing.FisherHotelling.test d1 d2
Multiple testing
When conducting multiple hypothesis test the α-error accumulates. This is because the p value just describes the probability for a false positive for one single test. If you perform 10 t-test at an α level of 0.05, the probability of getting a significant result by chance is 40.1% [ (1-(1-α)k ].
let aErrorAcc =
    [1. .. 100.]
    |> List.map (fun x -> x,(1. - 0.95**x))
    |> Chart.Line
    |> Chart.withXAxisStyle ( "number of tests (k)" )
    |> Chart.withYAxisStyle ( "probability of at least one false positive test")
|
To compensate this inflation, several multiple testing corrections were published. The most conservative method is the Bonferroni correction, where the used α level is divided by the number of performed tests.
A modern correction approach is the Benjamini-Hochberg method also known as FDR (false discovery rate).
Benjamini-Hochberg
let pValues =
    [|
        0.000002;0.000048;0.000096;0.000096;0.000351;0.000368;0.000368;0.000371;0.000383;0.000383;0.000705;0.000705;0.000705;0.000705;0.000739;0.00101;0.001234;0.001509;0.001509;0.001509;0.001509;0.001686;0.001686;0.001964;0.001964;0.001964;0.001964;0.001964;0.001964;0.001964;0.002057;0.002295;0.002662;0.002662;
        0.002662;0.002662;0.002662;0.002662;0.002662;0.002672;0.002714;0.002922;0.00348;0.004066;0.004176;0.004176;0.004562;0.004562;0.005848;0.005848;0.006277;0.007024;0.007614;0.007614;0.007614;0.007614;0.007614;0.00979;0.01049;0.01049;0.012498;0.012498;0.012498;0.017908;0.018822;0.019003;0.019003;0.019003;
        0.020234;0.02038;0.021317;0.023282;0.026069;0.026773;0.027255;0.027255;0.027255;0.027255;0.0274;0.030338;0.03128;0.034516;0.034516;0.037267;0.037267;0.040359;0.042706;0.043506;0.04513;0.04513;0.047135;0.049261;0.049261;0.049261;0.049261;0.049333;0.050457;0.052112;0.052476;0.060504;0.063031;0.063031;
        0.063031;0.063031;0.065316;0.065316;0.066751;0.067688;0.069676;0.073043;0.078139;0.078594;0.078594;0.095867;0.098913;0.102606;0.102606;0.102606;0.107444;0.116213;0.126098;0.135099;0.135099;0.159786;0.179654;0.199372;0.203542;0.203542;0.211249;0.211968;0.226611;0.228287;0.238719;0.247204;0.263942;
        0.263942;0.289175;0.306064;0.330191;0.330191;0.340904;0.343869;0.350009;0.355614;0.355614;0.359354;0.386018;0.386018;0.434486;0.438791;0.464694;0.471015;0.4715;0.479307;0.490157;0.505652;0.539465;0.539465;0.558338;0.558338;0.601991;0.61052;0.634365;0.637835;0.677506;0.678222;0.727881;0.748533;
        0.753718;0.758701;0.810979;0.838771;0.854833;0.872159;0.878727;0.890621;0.916361;0.954779;0.98181;0.985365;0.986261;0.98958;0.99861;0.99861;0.999602;0.999895
    |] |> Array.sort

let pValsAdj =
    MultipleTesting.benjaminiHochbergFDR pValues

let bhValues =
    [
        Chart.Line(pValues,pValues,Name="diagonal")
        Chart.Line(pValues,pValsAdj,Name="adj")
    ]
    |> Chart.combine
    |> Chart.withXAxisStyle "pValue"
    |> Chart.withYAxisStyle "BH corrected pValue"
|
Q Value
A q value defines the proportion of false positives there are within all discoveries that were called significant up to the current item. It serves as multiple testing correction procedure if a great proportion of tests are reported to be significant, and therefore Benjamini-Hochberg-correction would underestimate the true positive test results. Qvalues with pi0 = 1 is equivalent to Benjamini-Hochber-Method. For an extensive introduction and application example, see q value blog post at fslabs.
\(m = \#tests\)
qValues
\(qvalue_p = \frac{\#(false positives)}{\#positives}\)
qValues robust
Corrects for small p values especially if the number of tests is low or the population distributions do not follow a normal distribution. The correction takes into account the probability of a false positive being reported in the first place.
\(qvalueRobust_p = \frac{\#(false positives)}{\#positives * (1 - (1 - p)**m)}\)
let pi0 =
    pValues
    |> MultipleTesting.Qvalues.pi0Bootstrap

pi0
|
let qValues =
    pValues
    |> MultipleTesting.Qvalues.ofPValues pi0

let qValuesRob =
    pValues
    |> MultipleTesting.Qvalues.ofPValuesRobust pi0

let qChart =
    [
        Chart.Line(pValues,qValues,Name="qValue")
        Chart.Line([(0.,pi0);(1.,pi0)],Name="pi<sub>0</sub>",LineDash=StyleParam.DrawingStyle.Dash)
        Chart.Line(pValues,qValuesRob,Name="qValueRobust")
    ]
    |> Chart.combine
    |> Chart.withTemplate ChartTemplates.lightMirrored
    |> Chart.withXAxisStyle ("p value",MinMax=(0.,1.))
    |> Chart.withYAxisStyle ("q Values",MinMax=(0.,1.))


let qHisto =
    [
        Chart.Histogram(pValues,XBins=TraceObjects.Bins.init(0.,1.,0.05),Name="pValues",HistNorm=HistNorm.ProbabilityDensity)
        Chart.Line([(0.,pi0);(1.,pi0)],Name="pi<sub>0</sub>",LineDash=StyleParam.DrawingStyle.Dash)
    ]
    |> Chart.combine
    |> Chart.withTemplate ChartTemplates.lightMirrored
    |> Chart.withXAxisStyle "p value"
    |> Chart.withYAxisStyle "density"
|
|
SAM
SAM (Significance Analysis of Microarrays) is a method developed to overcome multiple testing problems. It was proposed, but not restricted for, microarray analysis. It serves as a blue print for a variety of permutation test. Therefore, high throughput experiments can be analysed using a combined permutation-bootstrap-method. For more in depth information see the SAM BlogPost.
Data:
To use SAM, expression or intensity data need to be in the format ('id * float[])[], where 'id is a generic type implementing System.IComparable.
In this example, 'id is the name of the gene, and float array being the replicates.
One way of achieving this is the following data preparation:
Columns are samples, here 1 and 2, representing control and treatment groups. Rows are transcript counts (here indicated with gene identifier).
The next step is to read in the data, e.g. via deedle, and to create a dataframe. The rows are indexed by the sample name and the rowkeys are extracted.
Here is the location where the dataset can be accessed: tests\FSharp.Stats.Tests\data\TestDataSAM.txt
let df:Frame<string,string> =
    Frame.ReadCsv(@"data/TestDataSAM.txt",hasHeaders=true,separators = "\t")
    // here, the name of A1 is needed.
    |> Frame.indexRows "gene"

// get Rowkeys as Array
let rowheader :string[] = df.RowKeys |> Seq.toArray

// to separate control and factor sets (sample1 and sample2, respectively),
// the datasets are chunked by the number of replicates (here: triplicates -> chunkBySize 3).
let (preData1,preData2) :float[][] * float [][]=
    df
    |> Frame.getRows
    |> Series.values
    |> Seq.map (Series.values >> Seq.toArray >> Array.chunkBySize 3 >> fun x -> x.[0],x.[1])
    |> Array.ofSeq
    |> Array.unzip

// After chunking, the datasets are separated by factor and the rowkey is added to the data for later identification.
let data1 = Array.zip rowheader preData1
let data2 = Array.zip  rowheader preData2
Optional: Data can be normalised by median centering using the following function. Thereby the median of each column is determined and subtracted it from each value in the respective column. Since samples do not influence each other it makes no difference if you center each column individually or center the whole data matrix prior to segragation.
With data1 and data2, or corrected1 and corrected2, SAM can be performed.
open SAM
let corrected1 =
    let medCorrect =
        medianCentering data1
    Array.zip rowheader medCorrect

let corrected2 =
    let medCorrect =
        medianCentering data2
    Array.zip rowheader medCorrect

let res = FSharp.Stats.Testing.SAM.twoClassUnpaired 100 0.05 data1 data2 (System.Random(1234))
Besides the data itself SAM requires the definition of some parameters:
- number of permutations: It seems to be sufficient to use ~ 100 permutations (also default in samR).
- desired FDR: While FDRs are given for each BioItem it is recommended to set a global FDR for the generation of the SAM plot.
- random seed: The seed is used for randomization of the permutations (System.Random()), or can be fixed to achieve the same results multiple times (e.g. System.Random(1234)).
The SAMResult<_> type summarizes all information required to construct the typical SAM plot:
- s0: fudge factor as described by Tusher et al. (2001)
- pi0: {pi0 ∈ R ∣ 0 < x < 1} estimated for the determination of qvalues
- delta: distance between the bisector and the parallel margins that separate nonsignificant from significant results
- upper/lower cut: y-axis intercepts that define significance-thresholds for the observed statistics
- positive/negative/non-significant bioitems
- False Discovery Rate (FDR)
- median number of false positives
The following snippet helps to generate the typical SAM plot.
let SAMChart =

    let observed = [| res.NegSigBioitem; res.NonSigBioitem; res.PosSigBioitem|] |> Array.concat
    let obs = observed |> Array.map (fun x -> x.Statistics)
    let expected = res.AveragePermutations |> Array.map (fun x -> x.Statistics)
    let minDi = Seq.min obs
    let maxDi = Seq.max obs


    // positive significant changes
    let posExpected = expected.[res.NegSigBioitem.Length + res.NonSigBioitem.Length .. res.NegSigBioitem.Length + res.NonSigBioitem.Length + res.PosSigBioitem.Length-1]
    let posChart =
        Chart.Point(posExpected,res.PosSigBioitem |> Array.map (fun x -> x.Statistics))
        |> Chart.withLineStyle(Color=Color.fromKeyword Green)
        |> Chart.withTraceInfo("positive change",Visible = Visible.True )


    // no significant changes
    let nonex = expected.[res.NegSigBioitem.Length .. res.NegSigBioitem.Length + res.NonSigBioitem.Length-1]
    let nonchart =
        Chart.Point(nonex,res.NonSigBioitem |> Array.map (fun x -> x.Statistics))
        |> Chart.withLineStyle(Color=Color.fromKeyword Gray)
        |> Chart.withTraceInfo("no change",Visible = Visible.True)

    // negative significant changes
    let negex = expected.[0 .. res.NegSigBioitem.Length-1]
    let negchart =
        Chart.Point(negex,res.NegSigBioitem |> Array.map (fun x -> x.Statistics))
        |> Chart.withLineStyle(Color=Color.fromKeyword Red)
        |> Chart.withTraceInfo("negative change",Visible = Visible.True)

    let samValues =
        [
            negchart
            nonchart
            posChart
        ]
        |> Chart.combine

    let chartConfig =
        let svdConfig =
            ConfigObjects.ToImageButtonOptions.init(
                Format = StyleParam.ImageFormat.SVG)
        Config.init (
            ToImageButtonOptions = svdConfig,
            ModeBarButtonsToAdd=[ModeBarButton.HoverCompareCartesian]

        )

    let cutLineUp = [(minDi + res.Delta) ; (maxDi + res.Delta)]
    let cutsUp =
        Chart.Line(cutLineUp,[minDi;maxDi])
        |> Chart.withLineStyle(Color=Color.fromKeyword Purple,Dash = StyleParam.DrawingStyle.Dash, Width = 0.5)
        |> Chart.withTraceInfo("delta",Visible = Visible.True)
    let cutLineLow = [(minDi - res.Delta) ; (maxDi - res.Delta)]
    let cutsLow =
        Chart.Line(cutLineLow,[minDi;maxDi])
        |> Chart.withLineStyle(Color=Color.fromKeyword Purple,Dash = StyleParam.DrawingStyle.Dash, Width = 0.5)
        |> Chart.withTraceInfo("delta",Visible = Visible.True)
    let linechart =
        Chart.Line([minDi;maxDi], [minDi;maxDi])
        |> Chart.withTraceInfo("bisecting angle",Visible = Visible.True)
        |> Chart.withLineStyle(Color=Color.fromKeyword Black, Width = 1)

    let uppercut =
        let xAnchorUppercut = [minDi .. 5. .. maxDi]
        Chart.Line (xAnchorUppercut, List.init xAnchorUppercut.Length (fun x -> res.UpperCut))

        |> Chart.withTraceInfo("upper cut",Visible = Visible.True)
        |> Chart.withLineStyle(Color=Color.fromKeyword Black,Dash = StyleParam.DrawingStyle.Dash, Width = 0.3)

    let lowercut =
        Chart.Line([minDi;maxDi],[res.LowerCut;res.LowerCut])
        |> Chart.withTraceInfo("lower cut",Visible = Visible.True)
        |> Chart.withLineStyle(Color=Color.fromKeyword Black,Dash = StyleParam.DrawingStyle.Dash,Width = 0.3)
        //|> Chart.withXAxisStyle(MinMax = (-15,20))

        |> Chart.withTraceInfo("lower cut",Visible = Visible.True)
    let plot =
        [linechart;
        samValues;
        cutsUp;
        cutsLow;
        uppercut;
        lowercut]
        |> Chart.combine
        |> Chart.withTitle(title = "SAM results")
        |> Chart.withXAxisStyle("expected Score")
        |> Chart.withYAxisStyle ("observed Score")
        |> Chart.withConfig(chartConfig)
        |> Chart.withTemplate(ChartTemplates.lightMirrored)
    plot
<summary> Contains mutable global default values. Changing these values will apply the default values to all consecutive Chart generations. </summary>
type DisplayOptions = inherit DynamicObj new: unit -> DisplayOptions static member addAdditionalHeadTags: additionalHeadTags: XmlNode list -> (DisplayOptions -> DisplayOptions) static member addDescription: description: XmlNode list -> (DisplayOptions -> DisplayOptions) static member combine: first: DisplayOptions -> second: DisplayOptions -> DisplayOptions static member getAdditionalHeadTags: displayOpts: DisplayOptions -> XmlNode list static member getDescription: displayOpts: DisplayOptions -> XmlNode list static member getPlotlyReference: displayOpts: DisplayOptions -> PlotlyJSReference static member init: [<Optional; DefaultParameterValue ((null :> obj))>] ?AdditionalHeadTags: XmlNode list * [<Optional; DefaultParameterValue ((null :> obj))>] ?Description: XmlNode list * [<Optional; DefaultParameterValue ((null :> obj))>] ?PlotlyJSReference: PlotlyJSReference -> DisplayOptions static member initCDNOnly: unit -> DisplayOptions ...
--------------------
new: unit -> Plotly.NET.DisplayOptions
<summary> Sets how plotly is referenced in the head of html docs. </summary>
namespace FSharp
--------------------
namespace Microsoft.FSharp
<summary> Computes a t-test or a Welch test (unequal variances) </summary>
<summary> which observations in one sample can be paired with observations in the other sample. </summary>
<summary> Calculates one-way analysis of variance (one-way ANOVA) which is a technique used to compare means of two or more samples (using the F distribution) The ANOVA tests the null hypothesis that samples in two or more groups are drawn from populations with the same mean values. </summary>
module Seq from FSharp.Stats
<summary> Module to compute common statistical measures. </summary>
--------------------
module Seq from FSharpAux
--------------------
module Seq from Microsoft.FSharp.Collections
--------------------
type Seq = new: unit -> Seq static member geomspace: start: float * stop: float * num: int * ?IncludeEndpoint: bool -> float seq static member linspace: start: float * stop: float * num: int * ?IncludeEndpoint: bool -> float seq
--------------------
new: unit -> Seq
<summary> Calculates two-way ANOVA as an extension of the one-way ANOVA for two independent variables. </summary>
<summary> F-test to compare two variances from data. </summary>
<summary> F-test to compare two variances from given parameters. </summary>
<summary> H-test / one-way ANOVA of ranks </summary>
<summary> Fisher's LSD. Sequential t tests with the variance estimated from all samples instead of the individual groups. FishersLSD requires ANOVA protection (apply ANOVA first). Not multiple testing corrected! Apply e.g. Benjamini-Hochberg method afterwards. </summary>
<summary> This module contains functions to adjust for multiple testing errors in statistical tests. </summary>
<summary> Benjamini-Hochberg Correction (BH) 'projection' should return a tuple of any identifier and the pValues as float, when applied to 'rawP' This function applies the Benjamini-Hochberg multiple testing correcture and returns all False Discovery Rates to which the given p-values are still significant. Note: corrected pValues are not sorted in original order! </summary>
module List from FSharp.Stats
<summary> Module to compute common statistical measure on list </summary>
--------------------
module List from FSharpAux
--------------------
module List from Microsoft.FSharp.Collections
--------------------
type List = new: unit -> List static member geomspace: start: float * stop: float * num: int * ?IncludeEndpoint: bool -> float list static member linspace: start: float * stop: float * num: int * ?IncludeEndpoint: bool -> float list
--------------------
type List<'T> = | op_Nil | op_ColonColon of Head: 'T * Tail: 'T list interface IReadOnlyList<'T> interface IReadOnlyCollection<'T> interface IEnumerable interface IEnumerable<'T> member GetReverseIndex: rank: int * offset: int -> int member GetSlice: startIndex: int option * endIndex: int option -> 'T list static member Cons: head: 'T * tail: 'T list -> 'T list member Head: 'T member IsEmpty: bool member Item: index: int -> 'T with get ...
--------------------
new: unit -> List
static member Chart.Table: headerValues: #('b seq) seq * cellsValues: #('d seq) seq * [<System.Runtime.InteropServices.Optional; System.Runtime.InteropServices.DefaultParameterValue ((true :> obj))>] ?TransposeCells: bool * [<System.Runtime.InteropServices.Optional; System.Runtime.InteropServices.DefaultParameterValue ((null :> obj))>] ?HeaderAlign: HorizontalAlign * [<System.Runtime.InteropServices.Optional; System.Runtime.InteropServices.DefaultParameterValue ((null :> obj))>] ?HeaderMultiAlign: HorizontalAlign seq * [<System.Runtime.InteropServices.Optional; System.Runtime.InteropServices.DefaultParameterValue ((null :> obj))>] ?HeaderFillColor: Color * [<System.Runtime.InteropServices.Optional; System.Runtime.InteropServices.DefaultParameterValue ((null :> obj))>] ?HeaderHeight: int * [<System.Runtime.InteropServices.Optional; System.Runtime.InteropServices.DefaultParameterValue ((null :> obj))>] ?HeaderOutlineColor: Color * [<System.Runtime.InteropServices.Optional; System.Runtime.InteropServices.DefaultParameterValue ((null :> obj))>] ?HeaderOutlineWidth: float * [<System.Runtime.InteropServices.Optional; System.Runtime.InteropServices.DefaultParameterValue ((null :> obj))>] ?HeaderOutlineMultiWidth: float seq * [<System.Runtime.InteropServices.Optional; System.Runtime.InteropServices.DefaultParameterValue ((null :> obj))>] ?HeaderOutline: Line * [<System.Runtime.InteropServices.Optional; System.Runtime.InteropServices.DefaultParameterValue ((null :> obj))>] ?CellsAlign: HorizontalAlign * [<System.Runtime.InteropServices.Optional; System.Runtime.InteropServices.DefaultParameterValue ((null :> obj))>] ?CellsMultiAlign: HorizontalAlign seq * [<System.Runtime.InteropServices.Optional; System.Runtime.InteropServices.DefaultParameterValue ((null :> obj))>] ?CellsFillColor: Color * [<System.Runtime.InteropServices.Optional; System.Runtime.InteropServices.DefaultParameterValue ((null :> obj))>] ?CellsHeight: int * [<System.Runtime.InteropServices.Optional; System.Runtime.InteropServices.DefaultParameterValue ((null :> obj))>] ?CellsOutlineColor: Color * [<System.Runtime.InteropServices.Optional; System.Runtime.InteropServices.DefaultParameterValue ((null :> obj))>] ?CellsOutlineWidth: float * [<System.Runtime.InteropServices.Optional; System.Runtime.InteropServices.DefaultParameterValue ((null :> obj))>] ?CellsOutlineMultiWidth: float seq * [<System.Runtime.InteropServices.Optional; System.Runtime.InteropServices.DefaultParameterValue ((null :> obj))>] ?CellsOutline: Line * [<System.Runtime.InteropServices.Optional; System.Runtime.InteropServices.DefaultParameterValue ((null :> obj))>] ?Name: string * [<System.Runtime.InteropServices.Optional; System.Runtime.InteropServices.DefaultParameterValue ((null :> obj))>] ?ColumnOrder: int seq * [<System.Runtime.InteropServices.Optional; System.Runtime.InteropServices.DefaultParameterValue ((null :> obj))>] ?ColumnWidth: float * [<System.Runtime.InteropServices.Optional; System.Runtime.InteropServices.DefaultParameterValue ((null :> obj))>] ?MultiColumnWidth: float seq * [<System.Runtime.InteropServices.Optional; System.Runtime.InteropServices.DefaultParameterValue ((true :> obj))>] ?UseDefaults: bool -> GenericChart.GenericChart (requires 'b :> System.IConvertible and 'd :> System.IConvertible)
<summary> Plotly color can be a single color, a sequence of colors, or a sequence of numeric values referencing the color of the colorscale obj </summary>
<summary> Module to represent a GenericChart </summary>
<summary> Tukey-Kramer approach </summary>
module Array from FSharp.Stats
<summary> Module to compute common statistical measure on array </summary>
--------------------
module Array from FSharpAux
--------------------
module Array from Microsoft.FSharp.Collections
--------------------
type Array = new: unit -> Array static member geomspace: start: float * stop: float * num: int * ?IncludeEndpoint: bool -> float array static member linspace: start: float * stop: float * num: int * ?IncludeEndpoint: bool -> float array
--------------------
new: unit -> Array
<summary> group mean difference </summary>
module String from FSharpAux
--------------------
module String from Microsoft.FSharp.Core
<summary> Dunnetts post hoc test compares groups to one control group (multiple-to-one comparison). Returns if the groups defined in the contrast differ significantly (already multi comparison corrected for FWER &lt; a) Critical value tables can be found in Testing.Tables </summary>
<summary> Some statistical tests lack in distributions for exact p value calculation. In order to enable the usage of these tests </summary>
<summary> Dunnetts table for two tailed, alpha = 0.05 </summary>
<summary> Fisher-Z transformation for Pearson correlation coefficient after Hotelling (1953) for n &lt; 50 </summary>
<summary> Pearson correlation (nan support by JackKnife leave one out) </summary>
static member Chart.Line: x: #System.IConvertible seq * y: #System.IConvertible seq * [<System.Runtime.InteropServices.Optional; System.Runtime.InteropServices.DefaultParameterValue ((null :> obj))>] ?ShowMarkers: bool * [<System.Runtime.InteropServices.Optional; System.Runtime.InteropServices.DefaultParameterValue ((null :> obj))>] ?Name: string * [<System.Runtime.InteropServices.Optional; System.Runtime.InteropServices.DefaultParameterValue ((null :> obj))>] ?ShowLegend: bool * [<System.Runtime.InteropServices.Optional; System.Runtime.InteropServices.DefaultParameterValue ((null :> obj))>] ?Opacity: float * [<System.Runtime.InteropServices.Optional; System.Runtime.InteropServices.DefaultParameterValue ((null :> obj))>] ?MultiOpacity: float seq * [<System.Runtime.InteropServices.Optional; System.Runtime.InteropServices.DefaultParameterValue ((null :> obj))>] ?Text: 'c * [<System.Runtime.InteropServices.Optional; System.Runtime.InteropServices.DefaultParameterValue ((null :> obj))>] ?MultiText: 'c seq * [<System.Runtime.InteropServices.Optional; System.Runtime.InteropServices.DefaultParameterValue ((null :> obj))>] ?TextPosition: TextPosition * [<System.Runtime.InteropServices.Optional; System.Runtime.InteropServices.DefaultParameterValue ((null :> obj))>] ?MultiTextPosition: TextPosition seq * [<System.Runtime.InteropServices.Optional; System.Runtime.InteropServices.DefaultParameterValue ((null :> obj))>] ?MarkerColor: Color * [<System.Runtime.InteropServices.Optional; System.Runtime.InteropServices.DefaultParameterValue ((null :> obj))>] ?MarkerColorScale: Colorscale * [<System.Runtime.InteropServices.Optional; System.Runtime.InteropServices.DefaultParameterValue ((null :> obj))>] ?MarkerOutline: Line * [<System.Runtime.InteropServices.Optional; System.Runtime.InteropServices.DefaultParameterValue ((null :> obj))>] ?MarkerSymbol: MarkerSymbol * [<System.Runtime.InteropServices.Optional; System.Runtime.InteropServices.DefaultParameterValue ((null :> obj))>] ?MultiMarkerSymbol: MarkerSymbol seq * [<System.Runtime.InteropServices.Optional; System.Runtime.InteropServices.DefaultParameterValue ((null :> obj))>] ?Marker: TraceObjects.Marker * [<System.Runtime.InteropServices.Optional; System.Runtime.InteropServices.DefaultParameterValue ((null :> obj))>] ?LineColor: Color * [<System.Runtime.InteropServices.Optional; System.Runtime.InteropServices.DefaultParameterValue ((null :> obj))>] ?LineColorScale: Colorscale * [<System.Runtime.InteropServices.Optional; System.Runtime.InteropServices.DefaultParameterValue ((null :> obj))>] ?LineWidth: float * [<System.Runtime.InteropServices.Optional; System.Runtime.InteropServices.DefaultParameterValue ((null :> obj))>] ?LineDash: DrawingStyle * [<System.Runtime.InteropServices.Optional; System.Runtime.InteropServices.DefaultParameterValue ((null :> obj))>] ?Line: Line * [<System.Runtime.InteropServices.Optional; System.Runtime.InteropServices.DefaultParameterValue ((null :> obj))>] ?AlignmentGroup: string * [<System.Runtime.InteropServices.Optional; System.Runtime.InteropServices.DefaultParameterValue ((null :> obj))>] ?OffsetGroup: string * [<System.Runtime.InteropServices.Optional; System.Runtime.InteropServices.DefaultParameterValue ((null :> obj))>] ?StackGroup: string * [<System.Runtime.InteropServices.Optional; System.Runtime.InteropServices.DefaultParameterValue ((null :> obj))>] ?Orientation: Orientation * [<System.Runtime.InteropServices.Optional; System.Runtime.InteropServices.DefaultParameterValue ((null :> obj))>] ?GroupNorm: GroupNorm * [<System.Runtime.InteropServices.Optional; System.Runtime.InteropServices.DefaultParameterValue ((null :> obj))>] ?Fill: Fill * [<System.Runtime.InteropServices.Optional; System.Runtime.InteropServices.DefaultParameterValue ((null :> obj))>] ?FillColor: Color * [<System.Runtime.InteropServices.Optional; System.Runtime.InteropServices.DefaultParameterValue ((null :> obj))>] ?FillPattern: TraceObjects.Pattern * [<System.Runtime.InteropServices.Optional; System.Runtime.InteropServices.DefaultParameterValue ((false :> obj))>] ?UseWebGL: bool * [<System.Runtime.InteropServices.Optional; System.Runtime.InteropServices.DefaultParameterValue ((true :> obj))>] ?UseDefaults: bool -> GenericChart.GenericChart (requires 'c :> System.IConvertible)
<summary> Benjamini-Hochberg Correction (BH) This function applies the Benjamini-Hochberg multiple testing correcture and returns all False Discovery Rates to which the given p-values are still significant. </summary>
<summary> Estimate the q-values for a given set of p-values. The q-value of a test measures the proportion of false positives incurred (called the false discovery rate) when that particular test is called significant. </summary>
<summary> Estimates pi0 from given p-Values by Storeys bootstrap method using default lambda's pi0 is the value to which, one can find certain values of the distribution at random. If this returns 0. default lambda needs to be smaller. One should use 'pi0BootstrapWithLambda' in this case. </summary>
<summary> Calculates q-values from given p-values and returns an array of qValues in the same order. nan p values are ignored and reported as nan. </summary>
<param name="pi0">can be calculated with 'pi0Bootstrap' or 'pi0BootstrapWithLambda'.</param>
<param name="pValues">sequence of p values to correct</param>
<summary> Calculates q-values from given p-values and returns an array of robust qValues in the same order. More robust for small p values when testcount is low, see Storey JD (2002) JRSS-B 64: 479-498. nan p values are ignored and reported as nan. </summary>
<param name="pi0">can be calculated with 'pi0Bootstrap' or 'pi0BootstrapWithLambda'.</param>
<param name="pValues">sequence of p values to correct</param>
<summary> Dash: Sets the drawing style of the lines segments in this trace. Sets the style of the lines. Set to a dash string type or a dash length in px. </summary>
static member Chart.Histogram: [<System.Runtime.InteropServices.Optional; System.Runtime.InteropServices.DefaultParameterValue ((null :> obj))>] ?X: 'a seq * [<System.Runtime.InteropServices.Optional; System.Runtime.InteropServices.DefaultParameterValue ((null :> obj))>] ?MultiX: 'a seq seq * [<System.Runtime.InteropServices.Optional; System.Runtime.InteropServices.DefaultParameterValue ((null :> obj))>] ?Y: 'b seq * [<System.Runtime.InteropServices.Optional; System.Runtime.InteropServices.DefaultParameterValue ((null :> obj))>] ?MultiY: 'b seq seq * [<System.Runtime.InteropServices.Optional; System.Runtime.InteropServices.DefaultParameterValue ((null :> obj))>] ?Orientation: Orientation * [<System.Runtime.InteropServices.Optional; System.Runtime.InteropServices.DefaultParameterValue ((null :> obj))>] ?Name: string * [<System.Runtime.InteropServices.Optional; System.Runtime.InteropServices.DefaultParameterValue ((null :> obj))>] ?ShowLegend: bool * [<System.Runtime.InteropServices.Optional; System.Runtime.InteropServices.DefaultParameterValue ((null :> obj))>] ?Opacity: float * [<System.Runtime.InteropServices.Optional; System.Runtime.InteropServices.DefaultParameterValue ((null :> obj))>] ?Text: 'c * [<System.Runtime.InteropServices.Optional; System.Runtime.InteropServices.DefaultParameterValue ((null :> obj))>] ?MultiText: 'c seq * [<System.Runtime.InteropServices.Optional; System.Runtime.InteropServices.DefaultParameterValue ((null :> obj))>] ?TextPosition: TextPosition * [<System.Runtime.InteropServices.Optional; System.Runtime.InteropServices.DefaultParameterValue ((null :> obj))>] ?HistFunc: HistFunc * [<System.Runtime.InteropServices.Optional; System.Runtime.InteropServices.DefaultParameterValue ((null :> obj))>] ?HistNorm: HistNorm * [<System.Runtime.InteropServices.Optional; System.Runtime.InteropServices.DefaultParameterValue ((null :> obj))>] ?AlignmentGroup: string * [<System.Runtime.InteropServices.Optional; System.Runtime.InteropServices.DefaultParameterValue ((null :> obj))>] ?OffsetGroup: string * [<System.Runtime.InteropServices.Optional; System.Runtime.InteropServices.DefaultParameterValue ((null :> obj))>] ?NBinsX: int * [<System.Runtime.InteropServices.Optional; System.Runtime.InteropServices.DefaultParameterValue ((null :> obj))>] ?NBinsY: int * [<System.Runtime.InteropServices.Optional; System.Runtime.InteropServices.DefaultParameterValue ((null :> obj))>] ?BinGroup: string * [<System.Runtime.InteropServices.Optional; System.Runtime.InteropServices.DefaultParameterValue ((null :> obj))>] ?XBins: TraceObjects.Bins * [<System.Runtime.InteropServices.Optional; System.Runtime.InteropServices.DefaultParameterValue ((null :> obj))>] ?YBins: TraceObjects.Bins * [<System.Runtime.InteropServices.Optional; System.Runtime.InteropServices.DefaultParameterValue ((null :> obj))>] ?MarkerColor: Color * [<System.Runtime.InteropServices.Optional; System.Runtime.InteropServices.DefaultParameterValue ((null :> obj))>] ?MarkerColorScale: Colorscale * [<System.Runtime.InteropServices.Optional; System.Runtime.InteropServices.DefaultParameterValue ((null :> obj))>] ?MarkerOutline: Line * [<System.Runtime.InteropServices.Optional; System.Runtime.InteropServices.DefaultParameterValue ((null :> obj))>] ?MarkerPatternShape: PatternShape * [<System.Runtime.InteropServices.Optional; System.Runtime.InteropServices.DefaultParameterValue ((null :> obj))>] ?MultiMarkerPatternShape: PatternShape seq * [<System.Runtime.InteropServices.Optional; System.Runtime.InteropServices.DefaultParameterValue ((null :> obj))>] ?MarkerPattern: TraceObjects.Pattern * [<System.Runtime.InteropServices.Optional; System.Runtime.InteropServices.DefaultParameterValue ((null :> obj))>] ?Marker: TraceObjects.Marker * [<System.Runtime.InteropServices.Optional; System.Runtime.InteropServices.DefaultParameterValue ((null :> obj))>] ?Line: Line * [<System.Runtime.InteropServices.Optional; System.Runtime.InteropServices.DefaultParameterValue ((null :> obj))>] ?XError: TraceObjects.Error * [<System.Runtime.InteropServices.Optional; System.Runtime.InteropServices.DefaultParameterValue ((null :> obj))>] ?YError: TraceObjects.Error * [<System.Runtime.InteropServices.Optional; System.Runtime.InteropServices.DefaultParameterValue ((null :> obj))>] ?Cumulative: TraceObjects.Cumulative * [<System.Runtime.InteropServices.Optional; System.Runtime.InteropServices.DefaultParameterValue ((null :> obj))>] ?HoverLabel: Hoverlabel * [<System.Runtime.InteropServices.Optional; System.Runtime.InteropServices.DefaultParameterValue ((true :> obj))>] ?UseDefaults: bool -> GenericChart.GenericChart (requires 'a :> System.IConvertible and 'b :> System.IConvertible and 'c :> System.IConvertible)
type Bins = inherit DynamicObj new: unit -> Bins static member init: [<Optional; DefaultParameterValue ((null :> obj))>] ?Start: float * [<Optional; DefaultParameterValue ((null :> obj))>] ?End: float * [<Optional; DefaultParameterValue ((null :> obj))>] ?Size: float -> Bins static member style: [<Optional; DefaultParameterValue ((null :> obj))>] ?Start: float * [<Optional; DefaultParameterValue ((null :> obj))>] ?End: float * [<Optional; DefaultParameterValue ((null :> obj))>] ?Size: float -> (Bins -> Bins)
<summary> Bin type inherits from dynamic object </summary>
--------------------
new: unit -> TraceObjects.Bins
<summary> Sets the type of normalization for this histogram trace. By default ('histnorm' set to '') the height of each bar displays the frequency of occurrence, i.e., the number of times this value was found in the corresponding bin. If set to 'percent', the height of each bar displays the percentage of total occurrences found within the corresponding bin. If set to 'probability', the height of each bar displays the probability that an event will fall into the corresponding bin. If set to 'density', the height of each bar is equal to the number of occurrences in a bin divided by the size of the bin interval such that summing the area of all bins will yield the total number of occurrences. If set to 'probability density', the height of each bar is equal to the number of probability that an event will fall into the corresponding bin divided by the size of the bin interval such that summing the area of all bins will yield 1. default: None </summary>
module Frame from Deedle
--------------------
type Frame = static member ReadCsv: location: string * [<Optional>] hasHeaders: Nullable<bool> * [<Optional>] inferTypes: Nullable<bool> * [<Optional>] inferRows: Nullable<int> * [<Optional>] schema: string * [<Optional>] separators: string * [<Optional>] culture: string * [<Optional>] maxRows: Nullable<int> * [<Optional>] missingValues: string array * [<Optional>] preferOptions: bool -> Frame<int,string> + 1 overload static member ReadReader: reader: IDataReader -> Frame<int,string> static member CustomExpanders: Dictionary<Type,Func<obj,(string * Type * obj) seq>> static member NonExpandableInterfaces: ResizeArray<Type> static member NonExpandableTypes: HashSet<Type>
--------------------
type Frame<'TRowKey,'TColumnKey (requires equality and equality)> = interface IDynamicMetaObjectProvider interface INotifyCollectionChanged interface IFrameFormattable interface IFsiFormattable interface IFrame new: rowIndex: IIndex<'TRowKey> * columnIndex: IIndex<'TColumnKey> * data: IVector<IVector> * indexBuilder: IIndexBuilder * vectorBuilder: IVectorBuilder -> Frame<'TRowKey,'TColumnKey> + 1 overload member AddColumn: column: 'TColumnKey * series: 'V seq -> unit + 3 overloads member AggregateRowsBy: groupBy: 'TColumnKey seq * aggBy: 'TColumnKey seq * aggFunc: Func<Series<'TRowKey,'a>,'b> -> Frame<int,'TColumnKey> member Clone: unit -> Frame<'TRowKey,'TColumnKey> member ColumnApply: f: Func<Series<'TRowKey,'T>,ISeries<'TRowKey>> -> Frame<'TRowKey,'TColumnKey> + 1 overload ...
--------------------
new: names: 'TColumnKey seq * columns: ISeries<'TRowKey> seq -> Frame<'TRowKey,'TColumnKey>
new: rowIndex: Indices.IIndex<'TRowKey> * columnIndex: Indices.IIndex<'TColumnKey> * data: IVector<IVector> * indexBuilder: Indices.IIndexBuilder * vectorBuilder: Vectors.IVectorBuilder -> Frame<'TRowKey,'TColumnKey>
val string: value: 'T -> string
--------------------
type string = System.String
static member Frame.ReadCsv: stream: System.IO.Stream * ?hasHeaders: bool * ?inferTypes: bool * ?inferRows: int * ?schema: string * ?separators: string * ?culture: string * ?maxRows: int * ?missingValues: string array * ?preferOptions: bool -> Frame<int,string>
static member Frame.ReadCsv: reader: System.IO.TextReader * ?hasHeaders: bool * ?inferTypes: bool * ?inferRows: int * ?schema: string * ?separators: string * ?culture: string * ?maxRows: int * ?missingValues: string array * ?preferOptions: bool -> Frame<int,string>
static member Frame.ReadCsv: stream: System.IO.Stream * [<System.Runtime.InteropServices.Optional>] hasHeaders: System.Nullable<bool> * [<System.Runtime.InteropServices.Optional>] inferTypes: System.Nullable<bool> * [<System.Runtime.InteropServices.Optional>] inferRows: System.Nullable<int> * [<System.Runtime.InteropServices.Optional>] schema: string * [<System.Runtime.InteropServices.Optional>] separators: string * [<System.Runtime.InteropServices.Optional>] culture: string * [<System.Runtime.InteropServices.Optional>] maxRows: System.Nullable<int> * [<System.Runtime.InteropServices.Optional>] missingValues: string array * [<System.Runtime.InteropServices.Optional>] preferOptions: System.Nullable<bool> -> Frame<int,string>
static member Frame.ReadCsv: location: string * [<System.Runtime.InteropServices.Optional>] hasHeaders: System.Nullable<bool> * [<System.Runtime.InteropServices.Optional>] inferTypes: System.Nullable<bool> * [<System.Runtime.InteropServices.Optional>] inferRows: System.Nullable<int> * [<System.Runtime.InteropServices.Optional>] schema: string * [<System.Runtime.InteropServices.Optional>] separators: string * [<System.Runtime.InteropServices.Optional>] culture: string * [<System.Runtime.InteropServices.Optional>] maxRows: System.Nullable<int> * [<System.Runtime.InteropServices.Optional>] missingValues: string array * [<System.Runtime.InteropServices.Optional>] preferOptions: bool -> Frame<int,string>
static member Frame.ReadCsv: path: string * indexCol: string * ?hasHeaders: bool * ?inferTypes: bool * ?inferRows: int * ?schema: string * ?separators: string * ?culture: string * ?maxRows: int * ?missingValues: string array * ?preferOptions: bool -> Frame<'R,string> (requires equality)
val float: value: 'T -> float (requires member op_Explicit)
--------------------
type float = System.Double
--------------------
type float<'Measure> = float
module Series from Deedle
--------------------
type Series = static member ofNullables: values: Nullable<'a0> seq -> Series<int,'a0> (requires default constructor and value type and 'a0 :> ValueType) static member ofObservations: observations: ('c * 'd) seq -> Series<'c,'d> (requires equality) static member ofOptionalObservations: observations: ('K * 'a1 option) seq -> Series<'K,'a1> (requires equality) static member ofValues: values: 'a seq -> Series<int,'a>
--------------------
type Series<'K,'V (requires equality)> = interface ISeriesFormattable interface IFsiFormattable interface ISeries<'K> new: index: IIndex<'K> * vector: IVector<'V> * vectorBuilder: IVectorBuilder * indexBuilder: IIndexBuilder -> Series<'K,'V> + 3 overloads member After: lowerExclusive: 'K -> Series<'K,'V> member Aggregate: aggregation: Aggregation<'K> * keySelector: Func<DataSegment<Series<'K,'V>>,'TNewKey> * valueSelector: Func<DataSegment<Series<'K,'V>>,OptionalValue<'R>> -> Series<'TNewKey,'R> (requires equality) + 1 overload member AsyncMaterialize: unit -> Async<Series<'K,'V>> member Before: upperExclusive: 'K -> Series<'K,'V> member Between: lowerInclusive: 'K * upperInclusive: 'K -> Series<'K,'V> member Compare: another: Series<'K,'V> -> Series<'K,Diff<'V>> ...
--------------------
new: pairs: System.Collections.Generic.KeyValuePair<'K,'V> seq -> Series<'K,'V>
new: keys: 'K seq * values: 'V seq -> Series<'K,'V>
new: keys: 'K array * values: 'V array -> Series<'K,'V>
new: index: Indices.IIndex<'K> * vector: IVector<'V> * vectorBuilder: Vectors.IVectorBuilder * indexBuilder: Indices.IIndexBuilder -> Series<'K,'V>
<summary> median centering of the data </summary>
<summary> default version of SAM. Two class unpaired calculation. Rnd can be either System.Random() or System.Random(seed). </summary>
type Random = new: unit -> unit + 1 overload member GetItems<'T> : choices: ReadOnlySpan<'T> * length: int -> 'T array + 2 overloads member Next: unit -> int + 2 overloads member NextBytes: buffer: byte array -> unit + 1 overload member NextDouble: unit -> float member NextInt64: unit -> int64 + 2 overloads member NextSingle: unit -> float32 member Shuffle<'T> : values: Span<'T> -> unit + 1 overload static member Shared: Random
<summary>Represents a pseudo-random number generator, which is an algorithm that produces a sequence of numbers that meet certain statistical requirements for randomness.</summary>
--------------------
System.Random() : System.Random
System.Random(Seed: int) : System.Random
<summary> Array of all negatively regulated bioitems at given FDR </summary>
<summary> Array of nonsignificant/unchanged bioitems at given FDR </summary>
<summary> Array of all positively regulated bioitems at given FDR </summary>
<summary> test statistics </summary>
<summary> Array of the expected values using the average of permutations </summary>
<summary>Gets the total number of elements in all the dimensions of the <see cref="T:System.Array" />.</summary>
<exception cref="T:System.OverflowException">The array is multidimensional and contains more than <see cref="F:System.Int32.MaxValue">Int32.MaxValue</see> elements.</exception>
<returns>The total number of elements in all the dimensions of the <see cref="T:System.Array" />; zero if there are no elements in the array.</returns>
static member Chart.Point: x: #System.IConvertible seq * y: #System.IConvertible seq * [<System.Runtime.InteropServices.Optional; System.Runtime.InteropServices.DefaultParameterValue ((null :> obj))>] ?Name: string * [<System.Runtime.InteropServices.Optional; System.Runtime.InteropServices.DefaultParameterValue ((null :> obj))>] ?ShowLegend: bool * [<System.Runtime.InteropServices.Optional; System.Runtime.InteropServices.DefaultParameterValue ((null :> obj))>] ?Opacity: float * [<System.Runtime.InteropServices.Optional; System.Runtime.InteropServices.DefaultParameterValue ((null :> obj))>] ?MultiOpacity: float seq * [<System.Runtime.InteropServices.Optional; System.Runtime.InteropServices.DefaultParameterValue ((null :> obj))>] ?Text: 'c * [<System.Runtime.InteropServices.Optional; System.Runtime.InteropServices.DefaultParameterValue ((null :> obj))>] ?MultiText: 'c seq * [<System.Runtime.InteropServices.Optional; System.Runtime.InteropServices.DefaultParameterValue ((null :> obj))>] ?TextPosition: TextPosition * [<System.Runtime.InteropServices.Optional; System.Runtime.InteropServices.DefaultParameterValue ((null :> obj))>] ?MultiTextPosition: TextPosition seq * [<System.Runtime.InteropServices.Optional; System.Runtime.InteropServices.DefaultParameterValue ((null :> obj))>] ?MarkerColor: Color * [<System.Runtime.InteropServices.Optional; System.Runtime.InteropServices.DefaultParameterValue ((null :> obj))>] ?MarkerColorScale: Colorscale * [<System.Runtime.InteropServices.Optional; System.Runtime.InteropServices.DefaultParameterValue ((null :> obj))>] ?MarkerOutline: Line * [<System.Runtime.InteropServices.Optional; System.Runtime.InteropServices.DefaultParameterValue ((null :> obj))>] ?MarkerSymbol: MarkerSymbol * [<System.Runtime.InteropServices.Optional; System.Runtime.InteropServices.DefaultParameterValue ((null :> obj))>] ?MultiMarkerSymbol: MarkerSymbol seq * [<System.Runtime.InteropServices.Optional; System.Runtime.InteropServices.DefaultParameterValue ((null :> obj))>] ?Marker: TraceObjects.Marker * [<System.Runtime.InteropServices.Optional; System.Runtime.InteropServices.DefaultParameterValue ((null :> obj))>] ?AlignmentGroup: string * [<System.Runtime.InteropServices.Optional; System.Runtime.InteropServices.DefaultParameterValue ((null :> obj))>] ?OffsetGroup: string * [<System.Runtime.InteropServices.Optional; System.Runtime.InteropServices.DefaultParameterValue ((null :> obj))>] ?StackGroup: string * [<System.Runtime.InteropServices.Optional; System.Runtime.InteropServices.DefaultParameterValue ((null :> obj))>] ?Orientation: Orientation * [<System.Runtime.InteropServices.Optional; System.Runtime.InteropServices.DefaultParameterValue ((null :> obj))>] ?GroupNorm: GroupNorm * [<System.Runtime.InteropServices.Optional; System.Runtime.InteropServices.DefaultParameterValue ((false :> obj))>] ?UseWebGL: bool * [<System.Runtime.InteropServices.Optional; System.Runtime.InteropServices.DefaultParameterValue ((true :> obj))>] ?UseDefaults: bool -> GenericChart.GenericChart (requires 'c :> System.IConvertible)
<summary> Determines whether or not this trace is visible. If "legendonly", the trace is not drawn, but can appear as a legend item (provided that the legend itself is visible). </summary>
type ToImageButtonOptions = inherit DynamicObj new: unit -> ToImageButtonOptions static member init: [<Optional; DefaultParameterValue ((null :> obj))>] ?Format: ImageFormat * [<Optional; DefaultParameterValue ((null :> obj))>] ?Filename: string * [<Optional; DefaultParameterValue ((null :> obj))>] ?Width: float * [<Optional; DefaultParameterValue ((null :> obj))>] ?Height: float * [<Optional; DefaultParameterValue ((null :> obj))>] ?Scale: float -> ToImageButtonOptions static member style: [<Optional; DefaultParameterValue ((null :> obj))>] ?Format: ImageFormat * [<Optional; DefaultParameterValue ((null :> obj))>] ?Filename: string * [<Optional; DefaultParameterValue ((null :> obj))>] ?Width: float * [<Optional; DefaultParameterValue ((null :> obj))>] ?Height: float * [<Optional; DefaultParameterValue ((null :> obj))>] ?Scale: float -> (ToImageButtonOptions -> ToImageButtonOptions)
--------------------
new: unit -> ConfigObjects.ToImageButtonOptions
type Format<'Printer,'State,'Residue,'Result> = PrintfFormat<'Printer,'State,'Residue,'Result>
--------------------
type Format<'Printer,'State,'Residue,'Result,'Tuple> = PrintfFormat<'Printer,'State,'Residue,'Result,'Tuple>
type Config = inherit DynamicObj new: unit -> Config static member combine: first: Config -> second: Config -> Config static member init: [<Optional; DefaultParameterValue ((null :> obj))>] ?StaticPlot: bool * [<Optional; DefaultParameterValue ((null :> obj))>] ?TypesetMath: bool * [<Optional; DefaultParameterValue ((null :> obj))>] ?PlotlyServerUrl: string * [<Optional; DefaultParameterValue ((null :> obj))>] ?Editable: bool * [<Optional; DefaultParameterValue ((null :> obj))>] ?Edits: Edits * [<Optional; DefaultParameterValue ((null :> obj))>] ?EditSelection: bool * [<Optional; DefaultParameterValue ((null :> obj))>] ?Autosizable: bool * [<Optional; DefaultParameterValue ((null :> obj))>] ?Responsive: bool * [<Optional; DefaultParameterValue ((null :> obj))>] ?FillFrame: bool * [<Optional; DefaultParameterValue ((null :> obj))>] ?FrameMargins: float * [<Optional; DefaultParameterValue ((null :> obj))>] ?ScrollZoom: ScrollZoom * [<Optional; DefaultParameterValue ((null :> obj))>] ?DoubleClick: DoubleClick * [<Optional; DefaultParameterValue ((null :> obj))>] ?DoubleClickDelay: int * [<Optional; DefaultParameterValue ((null :> obj))>] ?ShowAxisDragHandles: bool * [<Optional; DefaultParameterValue ((null :> obj))>] ?ShowAxisRangeEntryBoxes: bool * [<Optional; DefaultParameterValue ((null :> obj))>] ?ShowTips: bool * [<Optional; DefaultParameterValue ((null :> obj))>] ?ShowLink: bool * [<Optional; DefaultParameterValue ((null :> obj))>] ?LinkText: string * [<Optional; DefaultParameterValue ((null :> obj))>] ?SendData: bool * [<Optional; DefaultParameterValue ((null :> obj))>] ?ShowSources: obj * [<Optional; DefaultParameterValue ((null :> obj))>] ?DisplayModeBar: bool * [<Optional; DefaultParameterValue ((null :> obj))>] ?ShowSendToCloud: bool * [<Optional; DefaultParameterValue ((null :> obj))>] ?ShowEditInChartStudio: bool * [<Optional; DefaultParameterValue ((null :> obj))>] ?ModeBarButtonsToRemove: ModeBarButton seq * [<Optional; DefaultParameterValue ((null :> obj))>] ?ModeBarButtonsToAdd: ModeBarButton seq * [<Optional; DefaultParameterValue ((null :> obj))>] ?ModeBarButtons: ModeBarButton seq seq * [<Optional; DefaultParameterValue ((null :> obj))>] ?ToImageButtonOptions: ToImageButtonOptions * [<Optional; DefaultParameterValue ((null :> obj))>] ?Displaylogo: bool * [<Optional; DefaultParameterValue ((null :> obj))>] ?Watermark: bool * [<Optional; DefaultParameterValue ((null :> obj))>] ?plotGlPixelRatio: float * [<Optional; DefaultParameterValue ((null :> obj))>] ?SetBackground: obj * [<Optional; DefaultParameterValue ((null :> obj))>] ?TopojsonURL: string * [<Optional; DefaultParameterValue ((null :> obj))>] ?MapboxAccessToken: string * [<Optional; DefaultParameterValue ((null :> obj))>] ?Logging: int * [<Optional; DefaultParameterValue ((null :> obj))>] ?NotifyOnLogging: int * [<Optional; DefaultParameterValue ((null :> obj))>] ?QueueLength: int * [<Optional; DefaultParameterValue ((null :> obj))>] ?GlobalTransforms: obj * [<Optional; DefaultParameterValue ((null :> obj))>] ?Locale: string * [<Optional; DefaultParameterValue ((null :> obj))>] ?Locales: obj -> Config static member style: [<Optional; DefaultParameterValue ((null :> obj))>] ?StaticPlot: bool * [<Optional; DefaultParameterValue ((null :> obj))>] ?TypesetMath: bool * [<Optional; DefaultParameterValue ((null :> obj))>] ?PlotlyServerUrl: string * [<Optional; DefaultParameterValue ((null :> obj))>] ?Editable: bool * [<Optional; DefaultParameterValue ((null :> obj))>] ?Edits: Edits * [<Optional; DefaultParameterValue ((null :> obj))>] ?EditSelection: bool * [<Optional; DefaultParameterValue ((null :> obj))>] ?Autosizable: bool * [<Optional; DefaultParameterValue ((null :> obj))>] ?Responsive: bool * [<Optional; DefaultParameterValue ((null :> obj))>] ?FillFrame: bool * [<Optional; DefaultParameterValue ((null :> obj))>] ?FrameMargins: float * [<Optional; DefaultParameterValue ((null :> obj))>] ?ScrollZoom: ScrollZoom * [<Optional; DefaultParameterValue ((null :> obj))>] ?DoubleClick: DoubleClick * [<Optional; DefaultParameterValue ((null :> obj))>] ?DoubleClickDelay: int * [<Optional; DefaultParameterValue ((null :> obj))>] ?ShowAxisDragHandles: bool * [<Optional; DefaultParameterValue ((null :> obj))>] ?ShowAxisRangeEntryBoxes: bool * [<Optional; DefaultParameterValue ((null :> obj))>] ?ShowTips: bool * [<Optional; DefaultParameterValue ((null :> obj))>] ?ShowLink: bool * [<Optional; DefaultParameterValue ((null :> obj))>] ?LinkText: string * [<Optional; DefaultParameterValue ((null :> obj))>] ?SendData: bool * [<Optional; DefaultParameterValue ((null :> obj))>] ?ShowSources: obj * [<Optional; DefaultParameterValue ((null :> obj))>] ?DisplayModeBar: bool * [<Optional; DefaultParameterValue ((null :> obj))>] ?ShowSendToCloud: bool * [<Optional; DefaultParameterValue ((null :> obj))>] ?ShowEditInChartStudio: bool * [<Optional; DefaultParameterValue ((null :> obj))>] ?ModeBarButtonsToRemove: ModeBarButton seq * [<Optional; DefaultParameterValue ((null :> obj))>] ?ModeBarButtonsToAdd: ModeBarButton seq * [<Optional; DefaultParameterValue ((null :> obj))>] ?ModeBarButtons: ModeBarButton seq seq * [<Optional; DefaultParameterValue ((null :> obj))>] ?ToImageButtonOptions: ToImageButtonOptions * [<Optional; DefaultParameterValue ((null :> obj))>] ?Displaylogo: bool * [<Optional; DefaultParameterValue ((null :> obj))>] ?Watermark: bool * [<Optional; DefaultParameterValue ((null :> obj))>] ?plotGlPixelRatio: float * [<Optional; DefaultParameterValue ((null :> obj))>] ?SetBackground: obj * [<Optional; DefaultParameterValue ((null :> obj))>] ?TopojsonURL: string * [<Optional; DefaultParameterValue ((null :> obj))>] ?MapboxAccessToken: string * [<Optional; DefaultParameterValue ((null :> obj))>] ?Logging: int * [<Optional; DefaultParameterValue ((null :> obj))>] ?NotifyOnLogging: int * [<Optional; DefaultParameterValue ((null :> obj))>] ?QueueLength: int * [<Optional; DefaultParameterValue ((null :> obj))>] ?GlobalTransforms: obj * [<Optional; DefaultParameterValue ((null :> obj))>] ?Locale: string * [<Optional; DefaultParameterValue ((null :> obj))>] ?Locales: obj -> (Config -> Config)
<summary> The Config object gets passed to the plotly renderer and contains render-specific options. </summary>
--------------------
new: unit -> Config
<summary> treshold, absolute difference between observed and expected statistics </summary>
<summary> first Statistic where the difference of observed and expected is greater than delta </summary>
<summary> first Statistic where the difference of observed and expected is greater than delta </summary>
static member Chart.withTitle: title: string * [<System.Runtime.InteropServices.Optional; System.Runtime.InteropServices.DefaultParameterValue ((null :> obj))>] ?TitleFont: Font -> (GenericChart.GenericChart -> GenericChart.GenericChart)
<summary>Provides static methods for the creation, copying, deletion, moving, and opening of a single file, and aids in the creation of <see cref="T:System.IO.FileStream" /> objects.</summary>
System.IO.File.ReadAllText(path: string, encoding: System.Text.Encoding) : string