Interpolation
![]()
![]()
Summary: This tutorial demonstrates several ways of interpolating with FSharp.Stats
Summary
With the FSharp.Stats.Interpolation module you can apply various interpolation methods. While interpolating functions always go through the input points (knots), methods to predict function values
from x values (or x vectors in multivariate interpolation) not contained in the input, vary greatly. A Interpolation type provides many common methods for interpolation of two dimensional data. These include
- Linear spline interpolation (connecting knots by straight lines)
- Polynomial interpolation
- Hermite spline interpolation
- Cubic spline interpolation with 5 boundary conditions
- Akima subspline interpolation
The following code snippet summarizes all interpolation methods. In the following sections, every method is discussed in detail!
open Plotly.NET
open FSharp.Stats

let testDataX = [|1. .. 10.|]

let testDataY = [|0.5;-1.;0.;0.;0.;0.;1.;1.;3.;3.5|]

let coefStep        = Interpolation.interpolate(testDataX,testDataY,InterpolationMethod.Step) // step function
let coefLinear      = Interpolation.interpolate(testDataX,testDataY,InterpolationMethod.LinearSpline) // Straight lines passing all points
let coefAkima       = Interpolation.interpolate(testDataX,testDataY,InterpolationMethod.AkimaSubSpline) // Akima cubic subspline
let coefCubicNa     = Interpolation.interpolate(testDataX,testDataY,InterpolationMethod.CubicSpline Interpolation.CubicSpline.BoundaryCondition.Natural) // cubic spline with f'' at borders is set to 0
let coefCubicPe     = Interpolation.interpolate(testDataX,testDataY,InterpolationMethod.CubicSpline Interpolation.CubicSpline.BoundaryCondition.Periodic) // cubic spline with equal f' at borders
let coefCubicNo     = Interpolation.interpolate(testDataX,testDataY,InterpolationMethod.CubicSpline Interpolation.CubicSpline.BoundaryCondition.NotAKnot) // cubic spline with continous f''' at second and penultimate knot
let coefCubicPa     = Interpolation.interpolate(testDataX,testDataY,InterpolationMethod.CubicSpline Interpolation.CubicSpline.BoundaryCondition.Parabolic) // cubic spline with quadratic polynomial at borders
let coefCubicCl     = Interpolation.interpolate(testDataX,testDataY,InterpolationMethod.CubicSpline (Interpolation.CubicSpline.BoundaryCondition.Clamped (0,-1))) // cubic spline with border f' set to 0 and -1
let coefHermite     = Interpolation.interpolate(testDataX,testDataY,InterpolationMethod.HermiteSpline HermiteMethod.CSpline)
let coefHermiteMono = Interpolation.interpolate(testDataX,testDataY,InterpolationMethod.HermiteSpline HermiteMethod.PreserveMonotonicity)
let coefHermiteSlop = Interpolation.interpolate(testDataX,testDataY,InterpolationMethod.HermiteSpline (HermiteMethod.WithSlopes (vector [0.;0.;0.;0.;0.;0.;0.;0.;0.;0.])))
let coefPolynomial  = Interpolation.interpolate(testDataX,testDataY,InterpolationMethod.Polynomial) // interpolating polynomial
let coefApproximate = Interpolation.Approximation.approxWithPolynomialFromValues(testDataX,testDataY,10,Interpolation.Approximation.Spacing.Chebyshev) //interpolating polynomial of degree 9 with knots spaced according to Chebysehv

let interpolationComparison =
    [
        Chart.Point(testDataX,testDataY,Name="data")
        [1. .. 0.01 .. 10.] |> List.map (fun x -> x,Interpolation.predict(coefStep)        x) |> Chart.Line |> Chart.withTraceInfo "Step"
        [1. .. 0.01 .. 10.] |> List.map (fun x -> x,Interpolation.predict(coefLinear)      x) |> Chart.Line |> Chart.withTraceInfo "Linear"
        [1. .. 0.01 .. 10.] |> List.map (fun x -> x,Interpolation.predict(coefAkima)       x) |> Chart.Line |> Chart.withTraceInfo "Akima"
        [1. .. 0.01 .. 10.] |> List.map (fun x -> x,Interpolation.predict(coefCubicNa)     x) |> Chart.Line |> Chart.withTraceInfo "Cubic_natural"
        [1. .. 0.01 .. 10.] |> List.map (fun x -> x,Interpolation.predict(coefCubicPe)     x) |> Chart.Line |> Chart.withTraceInfo "Cubic_periodic"
        [1. .. 0.01 .. 10.] |> List.map (fun x -> x,Interpolation.predict(coefCubicNo)     x) |> Chart.Line |> Chart.withTraceInfo "Cubic_notaknot"
        [1. .. 0.01 .. 10.] |> List.map (fun x -> x,Interpolation.predict(coefCubicPa)     x) |> Chart.Line |> Chart.withTraceInfo "Cubic_parabolic"
        [1. .. 0.01 .. 10.] |> List.map (fun x -> x,Interpolation.predict(coefCubicCl)     x) |> Chart.Line |> Chart.withTraceInfo "Cubic_clamped"
        [1. .. 0.01 .. 10.] |> List.map (fun x -> x,Interpolation.predict(coefHermite)     x) |> Chart.Line |> Chart.withTraceInfo "Hermite cSpline"
        [1. .. 0.01 .. 10.] |> List.map (fun x -> x,Interpolation.predict(coefHermiteMono) x) |> Chart.Line |> Chart.withTraceInfo "Hermite monotone"
        [1. .. 0.01 .. 10.] |> List.map (fun x -> x,Interpolation.predict(coefHermiteSlop) x) |> Chart.Line |> Chart.withTraceInfo "Hermite slope"
        [1. .. 0.01 .. 10.] |> List.map (fun x -> x,Interpolation.predict(coefPolynomial)  x) |> Chart.Line |> Chart.withTraceInfo "Polynomial"
        [1. .. 0.01 .. 10.] |> List.map (fun x -> x,coefApproximate.Predict x)                |> Chart.Line |> Chart.withTraceInfo "Chebyshev"
    ]
    |> Chart.combine
    |> Chart.withTemplate ChartTemplates.lightMirrored
    |> Chart.withXAxisStyle("x data")
    |> Chart.withYAxisStyle("y data")
    |> Chart.withSize(800.,600.)
Polynomial Interpolation
Here a polynomial is fitted to the data. In general, a polynomial with degree = dataPointNumber - 1 has sufficient flexibility to interpolate all data points. The least squares approach is not sufficient to converge to an interpolating polynomial! A degree other than n-1 results in a regression polynomial.
open Plotly.NET
open FSharp.Stats

let xData = vector [|1.;2.;3.;4.;5.;6.|]
let yData = vector [|4.;7.;9.;8.;7.;9.;|]

//Polynomial interpolation

//Define the polynomial coefficients. In Interpolation the order is equal to the data length - 1.
let coefficients =
    Interpolation.Polynomial.interpolate xData yData
let interpolFunction x =
    Interpolation.Polynomial.predict coefficients x

let rawChart =
    Chart.Point(xData,yData)
    |> Chart.withTraceInfo "raw data"

let interpolPol =
    let fit = [|1. .. 0.1 .. 6.|] |> Array.map (fun x -> x,interpolFunction x)
    fit
    |> Chart.Line
    |> Chart.withTraceInfo "interpolating polynomial"

let chartPol =
    [rawChart;interpolPol]
    |> Chart.combine
    |> Chart.withTemplate ChartTemplates.lightMirrored
Cubic spline interpolation
Splines are flexible strips of wood, that were used by shipbuilders to draw smooth shapes. In graphics and mathematics a piecewise cubic polynomial (order = 3) is called spline. The curvature (second derivative) of a cubic polynomial is proportional to its tense energy and in spline theory the curvature is minimized. Therefore, the resulting function is very smooth. To solve for the spline coefficients it is necessary to define two additional constraints, so called boundary conditions:
natural spline (most used spline variant):
f''at borders is set to 0periodic spline:
f'at first point is the same asf'at the last pointparabolic spline:
f''at first/second and last/penultimate knot are equalnotAKnot spline:
f'''at second and penultimate knot are continuous- quadratic spline: first and last polynomial are quadratic, not cubic
clamped spline:
f'at first and last knot are set by user
In general, piecewise cubic splines only are defined within the region defined by the used x values. Using predict with x values outside this range, uses the slopes and intersects of the nearest knot and utilizes them for prediction.
Related information
open Plotly.NET
open FSharp.Stats.Interpolation

let xValues = vector [1.;2.;3.;4.;5.5;6.]
let yValues = vector [1.;8.;6.;3.;7.;1.]

//calculates the spline coefficients for a natural spline
let coeffSpline =
    CubicSpline.interpolate CubicSpline.BoundaryCondition.Natural xValues yValues

//cubic interpolating splines are only defined within the region defined in xValues
let interpolateFunctionWithinRange  x =
    CubicSpline.predictWithinRange coeffSpline x

//to interpolate x_Values that are out of the region defined in xValues
//interpolates the interpolation spline with linear prediction at borderknots
let interpolateFunction x =
    CubicSpline.predict coeffSpline x

//to compare the spline interpolate with an interpolating polynomial:
let coeffPolynomial =
    Interpolation.Polynomial.interpolate xValues yValues
let interpolateFunctionPol x =
    Interpolation.Polynomial.predict coeffPolynomial x
//A linear spline draws straight lines to interpolate all data
let coeffLinearSpline = Interpolation.LinearSpline.interpolate (Array.ofSeq xValues) (Array.ofSeq yValues)
let interpolateFunctionLinSp = Interpolation.LinearSpline.predict coeffLinearSpline

let splineChart =
    [
    Chart.Point(xValues,yValues)                                        |> Chart.withTraceInfo "raw data"
    [ 1. .. 0.1 .. 6.] |> List.map (fun x -> x,interpolateFunctionPol x)        |> Chart.Line |> Chart.withTraceInfo "fitPolynomial"
    [-1. .. 0.1 .. 8.] |> List.map (fun x -> x,interpolateFunction x)           |> Chart.Line |> Chart.withLineStyle(Dash=StyleParam.DrawingStyle.Dash) |> Chart.withTraceInfo "fitSpline"
    [ 1. .. 0.1 .. 6.] |> List.map (fun x -> x,interpolateFunctionWithinRange x)|> Chart.Line |> Chart.withTraceInfo "fitSpline_withinRange"
    [ 1. .. 0.1 .. 6.] |> List.map (fun x -> x,interpolateFunctionLinSp x)      |> Chart.Line |> Chart.withTraceInfo "fitLinearSpline"
    ]
    |> Chart.combine
    |> Chart.withTitle "Interpolation methods"
    |> Chart.withTemplate ChartTemplates.lightMirrored
//additionally you can calculate the derivatives of the spline
//The cubic spline interpolation is continuous in f, f', and  f''.
let derivativeChart =
    [
        Chart.Point(xValues,yValues) |> Chart.withTraceInfo "raw data"
        [1. .. 0.1 .. 6.] |> List.map (fun x -> x,interpolateFunction x) |> Chart.Line  |> Chart.withTraceInfo "spline fit"
        [1. .. 0.1 .. 6.] |> List.map (fun x -> x,CubicSpline.getFirstDerivative  coeffSpline x) |> Chart.Point |> Chart.withTraceInfo "fst derivative"
        [1. .. 0.1 .. 6.] |> List.map (fun x -> x,CubicSpline.getSecondDerivative coeffSpline x) |> Chart.Point |> Chart.withTraceInfo "snd derivative"
        [1. .. 0.1 .. 6.] |> List.map (fun x -> x,CubicSpline.getThirdDerivative  coeffSpline x) |> Chart.Point |> Chart.withTraceInfo "trd derivative"
    ]
    |> Chart.combine
    |> Chart.withTitle "Cubic spline derivatives"
    |> Chart.withTemplate ChartTemplates.lightMirrored
Akima subspline interpolation
Akima subsplines are highly connected to default cubic spline interpolation. The main difference is the missing constraint of curvature continuity. This enhanced curvature flexibility diminishes oscillations of the interpolating piecewise cubic subsplines. Subsplines differ from regular splines because they are discontinuous in the second derivative. See http://www.dorn.org/uni/sls/kap06/f08_0204.htm for more information.
let xVal = [|1. .. 10.|]
let yVal = [|1.;-0.5;2.;2.;2.;3.;3.;3.;5.;4.|]

let akimaCoeffs = Akima.interpolate xVal yVal

let akima =
    [0. .. 0.1 .. 11.]
    |> List.map (fun x ->
        x,Akima.predict akimaCoeffs x)
    |> Chart.Line

let cubicCoeffs = CubicSpline.interpolate CubicSpline.BoundaryCondition.Natural (vector xVal) (vector yVal)

let cubicSpline =
    [0. .. 0.1 .. 11.]
    |> List.map (fun x ->
        x,CubicSpline.predict cubicCoeffs x)
    |> Chart.Line

let akimaChart =
    [
        Chart.Point(xVal,yVal,Name="data")
        cubicSpline |> Chart.withTraceInfo "cubic spline"
        akima |> Chart.withTraceInfo "akima spline"
    ]
    |> Chart.combine
    |> Chart.withTitle "Cubic spline derivatives"
    |> Chart.withTemplate ChartTemplates.lightMirrored
Hermite interpolation
In Hermite interpolation the user can define the slopes of the function in the knots. This is especially useful if the function is oscillating and thereby generates local minima/maxima. Intuitively the slope of a knot should be between the slopes of the adjacent straight lines. By using this slope calculation a monotone knot behavior results in a monotone spline.
open FSharp.Stats
open FSharp.Stats.Interpolation
open Plotly.NET

//example from http://www.korf.co.uk/spline.pdf
let xDataH = vector [0.;10.;30.;50.;70.;80.;82.]
let yDataH = vector [150.;200.;200.;200.;180.;100.;0.]

//Get slopes for Hermite spline. Try to interpolate a monotone function.
let tryMonotoneSlope = CubicSpline.Hermite.interpolatePreserveMonotonicity xDataH yDataH
//get function for Hermite spline
let funHermite = fun x -> CubicSpline.Hermite.predict tryMonotoneSlope x

//get coefficients and function for a classic natural spline
let coeffSpl = CubicSpline.interpolate CubicSpline.BoundaryCondition.Natural xDataH yDataH
let funNaturalSpline x = CubicSpline.predict coeffSpl x

//get coefficients and function for a classic polynomial interpolation
let coeffPolInterpol =
    //let neutralWeights = Vector.init 7 (fun x -> 1.)
    //Fitting.LinearRegression.OLS.Polynomial.coefficientsWithWeighting 6 neutralWeights xDataH yDataH
    Interpolation.Polynomial.interpolate xDataH yDataH
let funPolInterpol x =
    //Fitting.LinearRegression.OLS.Polynomial.fit 6 coeffPolInterpol x
    Interpolation.Polynomial.predict coeffPolInterpol x

let splineComparison =
    [
    Chart.Point(xDataH,yDataH) |> Chart.withTraceInfo "raw data"
    [0. .. 82.] |> List.map (fun x -> x,funNaturalSpline x) |> Chart.Line  |> Chart.withTraceInfo "natural spline"
    [0. .. 82.] |> List.map (fun x -> x,funHermite x      ) |> Chart.Line  |> Chart.withTraceInfo "hermite spline"
    [0. .. 82.] |> List.map (fun x -> x,funPolInterpol x  ) |> Chart.Line  |> Chart.withTraceInfo "polynomial"
    ]
    |> Chart.combine
    |> Chart.withTemplate ChartTemplates.lightMirrored
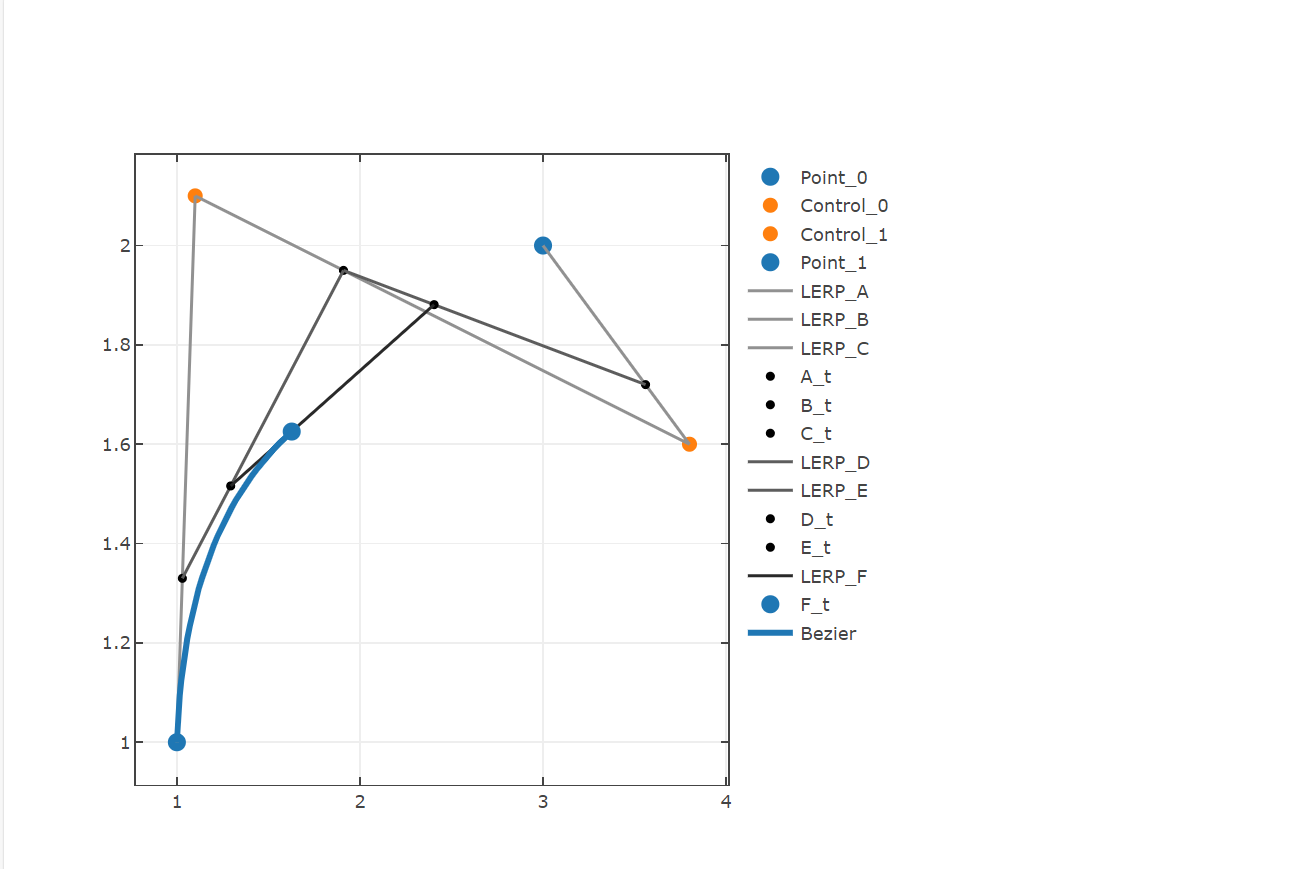
Bezier interpolation
In Bezier interpolation the user can define control points in order to interpolate between points. The first and last point (within the given coordinate sequence) are interpolated, while all others serve as control points that stretch the connection. If there is just one control point (coordinate collection length=3) the resulting curve is quadratic, two control points create a cubic curve etc.. Nested LERPs are used to identify the desired y-value from an given x value.
open FSharp.Stats
open FSharp.Stats.Interpolation
open Plotly.NET

let bezierInterpolation =
    let t = 0.3
    let p0 = vector [|3.;0.|] //point 0 that should be traversed
    let c0 = vector [|-1.5;8.|] //control point 0
    let c1 = vector [|1.5;9.|] //control point 1
    let c2 = vector [|6.5;-1.5|] //control point 2
    let c3 = vector [|13.5;4.|] //control point 3
    let p1 = vector [|10.;5.|] //point 1 that should be traversed
    let toPoint (v : Vector<float>) = v[0],v[1]
    let interpolate = Bezier.interpolate [|p0;c0;c1;c2;c3;p1|] >> toPoint

    [
        Chart.Point([p0.[0]],[p0.[1]],Name="Point_0",MarkerColor=Color.fromHex "#1f77b4") |> Chart.withMarkerStyle(Size=12)
        Chart.Point([c0.[0]],[c0.[1]],Name="Control_0",MarkerColor=Color.fromHex "#ff7f0e")|> Chart.withMarkerStyle(Size=10)
        Chart.Point([c1.[0]],[c1.[1]],Name="Control_1",MarkerColor=Color.fromHex "#ff7f0e")|> Chart.withMarkerStyle(Size=10)
        Chart.Point([c2.[0]],[c2.[1]],Name="Control_2",MarkerColor=Color.fromHex "#ff7f0e")|> Chart.withMarkerStyle(Size=10)
        Chart.Point([c3.[0]],[c3.[1]],Name="Control_3",MarkerColor=Color.fromHex "#ff7f0e")|> Chart.withMarkerStyle(Size=10)
        Chart.Point([p1.[0]],[p1.[1]],Name="Point_1",MarkerColor=Color.fromHex "#1f77b4") |> Chart.withMarkerStyle(Size=12)

        [0. .. 0.01 .. 1.] |> List.map interpolate |> Chart.Line |> Chart.withTraceInfo "Bezier" |> Chart.withLineStyle(Color=Color.fromHex "#1f77b4")
    ]
    |> Chart.combine
    |> Chart.withTemplate ChartTemplates.lightMirrored
Bezier interpolation is not limited to 2D points, it can be also be used to interpolate vectors.
let bezierInterpolation3d =
    let p0 = vector [|1.;1.;1.|] //point 0 that should be traversed
    let c0 = vector [|1.5;2.1;2.|] //control point 0
    let c1 = vector [|5.8;1.6;1.4|] //control point 1
    let p1 = vector [|3.;2.;0.|] //point 1 that should be traversed
    let to3Dpoint (v : Vector<float>) = v[0],v[1],v[2]
    let interpolate = Bezier.interpolate [|p0;c0;c1;p1|] >> to3Dpoint

    [
        Chart.Point3D([p0.[0]],[p0.[1]],[p0.[2]],Name="Point_0",MarkerColor=Color.fromHex "#1f77b4") |> Chart.withMarkerStyle(Size=12)
        Chart.Point3D([c0.[0]],[c0.[1]],[c0.[2]],Name="Control_0",MarkerColor=Color.fromHex "#ff7f0e")|> Chart.withMarkerStyle(Size=10)
        Chart.Point3D([c1.[0]],[c1.[1]],[c1.[2]],Name="Control_1",MarkerColor=Color.fromHex "#ff7f0e")|> Chart.withMarkerStyle(Size=10)
        Chart.Point3D([p1.[0]],[p1.[1]],[p1.[2]],Name="Point_1",MarkerColor=Color.fromHex "#1f77b4") |> Chart.withMarkerStyle(Size=12)

        [0. .. 0.01 .. 1.] |> List.map interpolate |> Chart.Line3D |> Chart.withTraceInfo "Bezier" |> Chart.withLineStyle(Color=Color.fromHex "#1f77b4",Width=10.)
    ]
    |> Chart.combine
    |> Chart.withTemplate ChartTemplates.lightMirrored
Chebyshev function approximation
Polynomials are great when it comes to slope/area determination or the investigation of signal properties. When faced with an unknown (or complex) function it may be beneficial to approximate the data using polynomials, even if it does not correspond to the real model.
Polynomial regression can cause difficulties if the signal is flexible and the required polynomial degree is high. Floating point errors sometimes lead to vanishing coefficients and even though the SSE should decrease, it does not and a strange, squiggly shape is generated. Polynomial interpolation can help to obtain a robust polynomial description of the data, but is prone to Runges phenomenon.
In the next section, data is introduced that should be converted to a polynomial approximation.
let xs = [|0. .. 0.2 .. 3.|]
let ys = [|5.;5.5;6.;6.1;4.;1.;0.7;0.3;0.5;0.9;5.;9.;9.;8.;6.5;5.;|]

let chebyChart =
    Chart.Line(xs,ys,Name="raw",ShowMarkers=true)
    |> Chart.withTemplate ChartTemplates.lightMirrored
Let's fit a interpolating polynomial to the points:
// calculates the coefficients of the interpolating polynomial
let coeffs =
    Interpolation.Polynomial.interpolate (vector xs) (vector ys)

// determines the y value of a given x value with the interpolating coefficients
let interpolatingFunction x =
    Interpolation.Polynomial.predict coeffs x

// plot the interpolated data
let interpolChart =
    let ys_interpol =
        [|0. .. 0.01 .. 3.|]
        |> Seq.map (fun x -> x,interpolatingFunction x)
    Chart.Line(ys_interpol,Name="interpol")
    |> Chart.withTemplate ChartTemplates.lightMirrored
    |> Chart.withXAxisStyle "xs"
    |> Chart.withYAxisStyle "ys"

let cbChart =
    [
    chebyChart
    interpolChart
    ]
    |> Chart.combine
Because of Runges phenomenon the interpolating polynomial overshoots in the outer areas of the data. It would be detrimental if this function approximation is used to investigate signal properties.
To reduce this overfitting you can use x axis nodes that are spaced according to Chebyshev. Here, nodes are sparse in the center of the analysed function and are more dense in the outer areas.
// new x values are determined in the x axis range of the data. These should reduce overshooting behaviour.
// since the original data consisted of 16 points, 16 nodes are initialized
let xs_cheby =
    Interpolation.Approximation.chebyshevNodes (Interval.CreateClosed<float>(0.,3.)) 16

// to get the corresponding y values to the xs_cheby a linear spline is generated that approximates the new y values
let ys_cheby =
    let ls = Interpolation.LinearSpline.interpolate xs ys
    xs_cheby |> Array.map (Interpolation.LinearSpline.predict ls)

// again polynomial interpolation coefficients are determined, but here with the x and y data that correspond to the chebyshev spacing
let coeffs_cheby = Interpolation.Polynomial.interpolate xs_cheby ys_cheby


// Note: the upper panel can be summarized by the follwing function:
Interpolation.Approximation.approxWithPolynomialFromValues(xData=xs,yData=ys,n=16,spacing=Approximation.Spacing.Chebyshev)
Using the determined polynomial coefficients, the standard approach for fitting can be used to plot the signal together with the function approximation. Obviously the example data is difficult to approximate, but the chebyshev spacing of the x-nodes drastically reduces the overfitting in the outer areas of the signal.
// function using the cheby_coefficients to get y values of given x value
let interpolating_cheby x = Interpolation.Polynomial.predict coeffs_cheby x

let interpolChart_cheby =
    let ys_interpol_cheby =
        vector [|0. .. 0.01 .. 3.|]
        |> Seq.map (fun x -> x,interpolating_cheby x)

    Chart.Line(ys_interpol_cheby,Name="interpol_cheby")
    |> Chart.withTemplate ChartTemplates.lightMirrored
    |> Chart.withXAxisStyle "xs"
    |> Chart.withYAxisStyle "ys"


let cbChart_cheby =
    [
    chebyChart
    interpolChart
    Chart.Line(xs_cheby,ys_cheby,ShowMarkers=true,Name="cheby_nodes") |> Chart.withTemplate ChartTemplates.lightMirrored|> Chart.withXAxisStyle "xs"|> Chart.withYAxisStyle "ys"
    interpolChart_cheby
    ]
    |> Chart.combine
    |> Chart.withTemplate ChartTemplates.lightMirrored
    |> Chart.withXAxisStyle "xs"
    |> Chart.withYAxisStyle "ys"
If a non-polynomal function should be approximated as polynomial you can use Interpolation.Approximation.approxWithPolynomial with specifying the interval in which the function should be approximated.
Further reading
- Amazing blog post regarding Runges phenomenon and chebyshev spacing https://www.mscroggs.co.uk/blog/57
<summary> Contains mutable global default values. Changing these values will apply the default values to all consecutive Chart generations. </summary>
type DisplayOptions = inherit DynamicObj new: unit -> DisplayOptions static member addAdditionalHeadTags: additionalHeadTags: XmlNode list -> (DisplayOptions -> DisplayOptions) static member addDescription: description: XmlNode list -> (DisplayOptions -> DisplayOptions) static member combine: first: DisplayOptions -> second: DisplayOptions -> DisplayOptions static member getAdditionalHeadTags: displayOpts: DisplayOptions -> XmlNode list static member getDescription: displayOpts: DisplayOptions -> XmlNode list static member getPlotlyReference: displayOpts: DisplayOptions -> PlotlyJSReference static member init: [<Optional; DefaultParameterValue ((null :> obj))>] ?AdditionalHeadTags: XmlNode list * [<Optional; DefaultParameterValue ((null :> obj))>] ?Description: XmlNode list * [<Optional; DefaultParameterValue ((null :> obj))>] ?PlotlyJSReference: PlotlyJSReference -> DisplayOptions static member initCDNOnly: unit -> DisplayOptions ...
--------------------
new: unit -> Plotly.NET.DisplayOptions
<summary> Sets how plotly is referenced in the head of html docs. </summary>
namespace FSharp
--------------------
namespace Microsoft.FSharp
module Interpolation from FSharp.Stats
<summary> This module contains functionalities to perform various interpolation methods for two dimensional data. </summary>
--------------------
type Interpolation = new: unit -> Interpolation static member getFirstDerivative: coef: InterpolationCoefficients -> (float -> float) static member getIntegralBetween: coef: InterpolationCoefficients * x1: float * x2: float -> float static member getSecondDerivative: coef: InterpolationCoefficients -> (float -> float) static member interpolate: xValues: float array * yValues: float array * method: InterpolationMethod -> InterpolationCoefficients static member predict: coef: InterpolationCoefficients -> (float -> float)
<summary> This type contains functionalities to perform various interpolation methods for two dimensional data. It summarizes functions contained within the interpolation module. </summary>
--------------------
new: unit -> Interpolation
<summary> Lets the user choose between 5 interpolation methods. One simply connects dots (LinearSpline), one forms a single interpolating polynomial (Polynomial, and three of them employ piecewise cubic polynomials. </summary>
<summary> Creates a step function from x,y coordinates. Coordinates are interpolated by straight horizontal lines between two knots. </summary>
<summary> Creates a linear spline from x,y coordinates. x,y coordinates are interpolated by straight lines between two knots. Equivalent to interval-wise simple linear regression between any neighbouring pair of data. </summary>
<summary> Creates a subspline as piecewise cubic polynomials with continuous first derivative but DIScontinuous second derivative at the knots. </summary>
<summary> Creates a spline as piecewise cubic polynomials with continuous first and second derivative at the knots. </summary>
<summary> Cubic splines interpolate two dimensional data by applying piecewise cubic polynomials that are continuous at the input coordinates (knots). The function itself, the first- and second derivative are continuous at the knots. </summary>
<summary>most used spline variant: f'' at borders is set to 0</summary>
<summary> f' at first point is the same as f' at the last point </summary>
<summary> f''' at second and penultimate knot are continuous </summary>
<summary> f'' at first/second and last/penultimate knot are equal </summary>
<summary> f' at first and last knot are set by user </summary>
<summary> Creates a spline as piecewise cubic polynomials with given slope. </summary>
<summary> Default hermite spline (cSpline) </summary>
<summary> Creates a spline from x,y coordinates. x,y coordinates are interpolated by cubic polynomials between two knots. If a region in the raw data is monotone, the resulting interpolator is monotone as well. </summary>
<summary> Creates a spline from x,y coordinates. x,y coordinates are interpolated by cubic polynomialsbetween two knots. The slope at each knot is defined by a input slope vector. </summary>
<summary> Creates a polynomial of degree n-1 that interpolate all n knots. </summary>
module Approximation from FSharp.Stats.InterpolationModule
<summary> Approximation </summary>
--------------------
type Approximation = new: unit -> Approximation static member approxWithPolynomial: f: (float -> float) * i: Interval<float> * n: int * spacing: Spacing -> PolynomialCoef static member approxWithPolynomialFromValues: xData: float seq * yData: float seq * n: int * spacing: Spacing -> PolynomialCoef
--------------------
new: unit -> Interpolation.Approximation
static member Chart.Point: x: #System.IConvertible seq * y: #System.IConvertible seq * [<System.Runtime.InteropServices.Optional; System.Runtime.InteropServices.DefaultParameterValue ((null :> obj))>] ?Name: string * [<System.Runtime.InteropServices.Optional; System.Runtime.InteropServices.DefaultParameterValue ((null :> obj))>] ?ShowLegend: bool * [<System.Runtime.InteropServices.Optional; System.Runtime.InteropServices.DefaultParameterValue ((null :> obj))>] ?Opacity: float * [<System.Runtime.InteropServices.Optional; System.Runtime.InteropServices.DefaultParameterValue ((null :> obj))>] ?MultiOpacity: float seq * [<System.Runtime.InteropServices.Optional; System.Runtime.InteropServices.DefaultParameterValue ((null :> obj))>] ?Text: 'c * [<System.Runtime.InteropServices.Optional; System.Runtime.InteropServices.DefaultParameterValue ((null :> obj))>] ?MultiText: 'c seq * [<System.Runtime.InteropServices.Optional; System.Runtime.InteropServices.DefaultParameterValue ((null :> obj))>] ?TextPosition: StyleParam.TextPosition * [<System.Runtime.InteropServices.Optional; System.Runtime.InteropServices.DefaultParameterValue ((null :> obj))>] ?MultiTextPosition: StyleParam.TextPosition seq * [<System.Runtime.InteropServices.Optional; System.Runtime.InteropServices.DefaultParameterValue ((null :> obj))>] ?MarkerColor: Color * [<System.Runtime.InteropServices.Optional; System.Runtime.InteropServices.DefaultParameterValue ((null :> obj))>] ?MarkerColorScale: StyleParam.Colorscale * [<System.Runtime.InteropServices.Optional; System.Runtime.InteropServices.DefaultParameterValue ((null :> obj))>] ?MarkerOutline: Line * [<System.Runtime.InteropServices.Optional; System.Runtime.InteropServices.DefaultParameterValue ((null :> obj))>] ?MarkerSymbol: StyleParam.MarkerSymbol * [<System.Runtime.InteropServices.Optional; System.Runtime.InteropServices.DefaultParameterValue ((null :> obj))>] ?MultiMarkerSymbol: StyleParam.MarkerSymbol seq * [<System.Runtime.InteropServices.Optional; System.Runtime.InteropServices.DefaultParameterValue ((null :> obj))>] ?Marker: TraceObjects.Marker * [<System.Runtime.InteropServices.Optional; System.Runtime.InteropServices.DefaultParameterValue ((null :> obj))>] ?AlignmentGroup: string * [<System.Runtime.InteropServices.Optional; System.Runtime.InteropServices.DefaultParameterValue ((null :> obj))>] ?OffsetGroup: string * [<System.Runtime.InteropServices.Optional; System.Runtime.InteropServices.DefaultParameterValue ((null :> obj))>] ?StackGroup: string * [<System.Runtime.InteropServices.Optional; System.Runtime.InteropServices.DefaultParameterValue ((null :> obj))>] ?Orientation: StyleParam.Orientation * [<System.Runtime.InteropServices.Optional; System.Runtime.InteropServices.DefaultParameterValue ((null :> obj))>] ?GroupNorm: StyleParam.GroupNorm * [<System.Runtime.InteropServices.Optional; System.Runtime.InteropServices.DefaultParameterValue ((false :> obj))>] ?UseWebGL: bool * [<System.Runtime.InteropServices.Optional; System.Runtime.InteropServices.DefaultParameterValue ((true :> obj))>] ?UseDefaults: bool -> GenericChart.GenericChart (requires 'c :> System.IConvertible)
module List from FSharp.Stats
<summary> Module to compute common statistical measure on list </summary>
--------------------
module List from Microsoft.FSharp.Collections
--------------------
type List = new: unit -> List static member geomspace: start: float * stop: float * num: int * ?IncludeEndpoint: bool -> float list static member linspace: start: float * stop: float * num: int * ?IncludeEndpoint: bool -> float list
--------------------
type List<'T> = | op_Nil | op_ColonColon of Head: 'T * Tail: 'T list interface IReadOnlyList<'T> interface IReadOnlyCollection<'T> interface IEnumerable interface IEnumerable<'T> member GetReverseIndex: rank: int * offset: int -> int member GetSlice: startIndex: int option * endIndex: int option -> 'T list static member Cons: head: 'T * tail: 'T list -> 'T list member Head: 'T member IsEmpty: bool member Item: index: int -> 'T with get ...
--------------------
new: unit -> List
static member Chart.Line: x: #System.IConvertible seq * y: #System.IConvertible seq * [<System.Runtime.InteropServices.Optional; System.Runtime.InteropServices.DefaultParameterValue ((null :> obj))>] ?ShowMarkers: bool * [<System.Runtime.InteropServices.Optional; System.Runtime.InteropServices.DefaultParameterValue ((null :> obj))>] ?Name: string * [<System.Runtime.InteropServices.Optional; System.Runtime.InteropServices.DefaultParameterValue ((null :> obj))>] ?ShowLegend: bool * [<System.Runtime.InteropServices.Optional; System.Runtime.InteropServices.DefaultParameterValue ((null :> obj))>] ?Opacity: float * [<System.Runtime.InteropServices.Optional; System.Runtime.InteropServices.DefaultParameterValue ((null :> obj))>] ?MultiOpacity: float seq * [<System.Runtime.InteropServices.Optional; System.Runtime.InteropServices.DefaultParameterValue ((null :> obj))>] ?Text: 'c * [<System.Runtime.InteropServices.Optional; System.Runtime.InteropServices.DefaultParameterValue ((null :> obj))>] ?MultiText: 'c seq * [<System.Runtime.InteropServices.Optional; System.Runtime.InteropServices.DefaultParameterValue ((null :> obj))>] ?TextPosition: StyleParam.TextPosition * [<System.Runtime.InteropServices.Optional; System.Runtime.InteropServices.DefaultParameterValue ((null :> obj))>] ?MultiTextPosition: StyleParam.TextPosition seq * [<System.Runtime.InteropServices.Optional; System.Runtime.InteropServices.DefaultParameterValue ((null :> obj))>] ?MarkerColor: Color * [<System.Runtime.InteropServices.Optional; System.Runtime.InteropServices.DefaultParameterValue ((null :> obj))>] ?MarkerColorScale: StyleParam.Colorscale * [<System.Runtime.InteropServices.Optional; System.Runtime.InteropServices.DefaultParameterValue ((null :> obj))>] ?MarkerOutline: Line * [<System.Runtime.InteropServices.Optional; System.Runtime.InteropServices.DefaultParameterValue ((null :> obj))>] ?MarkerSymbol: StyleParam.MarkerSymbol * [<System.Runtime.InteropServices.Optional; System.Runtime.InteropServices.DefaultParameterValue ((null :> obj))>] ?MultiMarkerSymbol: StyleParam.MarkerSymbol seq * [<System.Runtime.InteropServices.Optional; System.Runtime.InteropServices.DefaultParameterValue ((null :> obj))>] ?Marker: TraceObjects.Marker * [<System.Runtime.InteropServices.Optional; System.Runtime.InteropServices.DefaultParameterValue ((null :> obj))>] ?LineColor: Color * [<System.Runtime.InteropServices.Optional; System.Runtime.InteropServices.DefaultParameterValue ((null :> obj))>] ?LineColorScale: StyleParam.Colorscale * [<System.Runtime.InteropServices.Optional; System.Runtime.InteropServices.DefaultParameterValue ((null :> obj))>] ?LineWidth: float * [<System.Runtime.InteropServices.Optional; System.Runtime.InteropServices.DefaultParameterValue ((null :> obj))>] ?LineDash: StyleParam.DrawingStyle * [<System.Runtime.InteropServices.Optional; System.Runtime.InteropServices.DefaultParameterValue ((null :> obj))>] ?Line: Line * [<System.Runtime.InteropServices.Optional; System.Runtime.InteropServices.DefaultParameterValue ((null :> obj))>] ?AlignmentGroup: string * [<System.Runtime.InteropServices.Optional; System.Runtime.InteropServices.DefaultParameterValue ((null :> obj))>] ?OffsetGroup: string * [<System.Runtime.InteropServices.Optional; System.Runtime.InteropServices.DefaultParameterValue ((null :> obj))>] ?StackGroup: string * [<System.Runtime.InteropServices.Optional; System.Runtime.InteropServices.DefaultParameterValue ((null :> obj))>] ?Orientation: StyleParam.Orientation * [<System.Runtime.InteropServices.Optional; System.Runtime.InteropServices.DefaultParameterValue ((null :> obj))>] ?GroupNorm: StyleParam.GroupNorm * [<System.Runtime.InteropServices.Optional; System.Runtime.InteropServices.DefaultParameterValue ((null :> obj))>] ?Fill: StyleParam.Fill * [<System.Runtime.InteropServices.Optional; System.Runtime.InteropServices.DefaultParameterValue ((null :> obj))>] ?FillColor: Color * [<System.Runtime.InteropServices.Optional; System.Runtime.InteropServices.DefaultParameterValue ((null :> obj))>] ?FillPattern: TraceObjects.Pattern * [<System.Runtime.InteropServices.Optional; System.Runtime.InteropServices.DefaultParameterValue ((false :> obj))>] ?UseWebGL: bool * [<System.Runtime.InteropServices.Optional; System.Runtime.InteropServices.DefaultParameterValue ((true :> obj))>] ?UseDefaults: bool -> GenericChart.GenericChart (requires 'c :> System.IConvertible)
<summary> takes x value to predict the corresponding interpolating y value </summary>
<returns>predicted y value with given polynomial coefficients at X=x</returns>
<example><code> // e.g. days since a certain event let xData = vector [|1.;2.;3.;4.;5.;6.|] // e.g. temperature measured at noon of the days specified in xData let yData = vector [|4.;7.;9.;8.;7.;9.;|] // Estimate the polynomial coefficients. In Interpolation the order is equal to the data length - 1. let coefficients = Interpolation.Polynomial.coefficients xData yData // Predict the temperature value at midnight between day 1 and 2. coefficients.Predict 1.5 </code></example>
static member Chart.withSize: [<System.Runtime.InteropServices.Optional; System.Runtime.InteropServices.DefaultParameterValue ((null :> obj))>] ?Width: int * [<System.Runtime.InteropServices.Optional; System.Runtime.InteropServices.DefaultParameterValue ((null :> obj))>] ?Height: int -> (GenericChart.GenericChart -> GenericChart.GenericChart)
<summary> Module to represent a GenericChart </summary>
<summary> Calculates polynomials that interpolatethe two dimensional data. The polynomial order is equal to the number of data points - 1. </summary>
<remarks> In general a polynomial with degree = datapointNumber - 1 is flexible enough to interpolate all datapoints. But polynomial regression with degree = datapointNumber - 1 cannot be used for polynomial interpolation because the least squares approach is not sufficient to converge interpolating. </remarks>
<summary> Calculates the polynomial coefficients for interpolating the given unsorted data. </summary>
<remarks>No duplicates allowed!</remarks>
<param name="xData">Note: Must not contain duplicate x values (use Approximation.regularizeValues to preprocess data!)</param>
<param name="yData">vector of y values</param>
<returns>vector of polynomial coefficients sorted as [constant;linear;quadratic;...]</returns>
<example><code> // e.g. days since a certain event let xData = vector [|1.;2.;3.;4.;5.;6.|] // e.g. e.g. temperature measured at noon of the days specified in xData let yData = vector [|4.;7.;9.;8.;7.;9.;|] // Estimate the polynomial coefficients. In Interpolation the order is equal to the data length - 1. let coefficients = Interpolation.Polynomial.coefficients xData yData </code></example>
<summary> takes polynomial coefficients and x value to predict the corresponding interpolating y value </summary>
<param name="coef">polynomial coefficients (e.g. determined by Polynomial.coefficients), sorted as [constant;linear;quadratic;...]</param>
<param name="x">x value of which the corresponding y value should be predicted</param>
<returns>predicted y value with given polynomial coefficients at X=x</returns>
<example><code> // e.g. days since a certain event let xData = vector [|1.;2.;3.;4.;5.;6.|] // e.g. temperature measured at noon of the days specified in xData let yData = vector [|4.;7.;9.;8.;7.;9.;|] // Estimate the polynomial coefficients. In Interpolation the order is equal to the data length - 1. let coefficients = Interpolation.Polynomial.coefficients xData yData // Predict the temperature value at midnight between day 1 and 2. Interpolation.Polynomial.fit coefficients 1.5 </code></example>
module Array from FSharp.Stats
<summary> Module to compute common statistical measure on array </summary>
--------------------
module Array from Microsoft.FSharp.Collections
--------------------
type Array = new: unit -> Array static member geomspace: start: float * stop: float * num: int * ?IncludeEndpoint: bool -> float array static member linspace: start: float * stop: float * num: int * ?IncludeEndpoint: bool -> float array
--------------------
new: unit -> Array
<summary> Computes coefficients for piecewise interpolating splines. In the form of [a0;b0;c0;d0;a1;b1;...;d(n-2)]. where: fn(x) = (an)x^3+(bn)x^2+(cn)x+(dn) </summary>
<param name="boundaryCondition">Condition that defines how slopes and curvatures are defined at the left- and rightmost knot</param>
<param name="xValues">Note: Must not contain duplicate x values (use Approximation.regularizeValues to preprocess data!)</param>
<param name="yValues">function value at x values</param>
<returns>Coefficients that define the interpolating function.</returns>
<example><code> // e.g. days since a certain event let xData = vector [|0.;1.;5.;4.;3.;|] // some measured feature let yData = vector [|1.;5.;4.;13.;17.|] // get coefficients for piecewise interpolating cubic polynomials let coefficients = CubicSpline.interpolate CubicSpline.BoundaryConditions.Natural xData yData </code></example>
<summary>most used spline variant: f'' at borders is set to 0</summary>
<summary> Returns function that takes x value (that lies within the range of input x values) and predicts the corresponding interpolating y value. </summary>
<param name="coefficients">Interpolation functions coefficients.</param>
<param name="x">X value of which the y value should be predicted.</param>
<returns>Function that takes an x value and returns function value.</returns>
<example><code> // e.g. days since a certain event let xData = vector [|0.;1.;5.;4.;3.;|] // some measured feature let yData = vector [|1.;5.;4.;13.;17.|] // get coefficients for piecewise interpolating cubic polynomials let coefficients = CubicSpline.interpolate CubicSpline.BoundaryConditions.Natural xData yData // get interpolating value let func = CubicSpline.predictWithinRange(coefLinSpl) // get function value at x=3.4 func 3.4 </code></example>
<remarks>Only defined within the range of the given xValues!</remarks>
<summary> Returns function that takes x value and predicts the corresponding interpolating y value. </summary>
<param name="coefficients">Interpolation functions coefficients.</param>
<param name="x">X value of which the y value should be predicted.</param>
<returns>Function that takes an x value and returns function value.</returns>
<example><code> // e.g. days since a certain event let xData = vector [|0.;1.;5.;4.;3.;|] // some measured feature let yData = vector [|1.;5.;4.;13.;17.|] // get coefficients for piecewise interpolating cubic polynomials let coefficients = CubicSpline.interpolate CubicSpline.BoundaryConditions.Natural xData yData // get interpolating function let func = CubicSpline.predict(coefLinSpl) // get function value at x=3.4 func 3.4 </code></example>
<remarks>x values outside of the xValue range are predicted by straight lines defined by the nearest knot!</remarks>
<summary> Calculates the polynomial coefficients for interpolating the given unsorted data. </summary>
<remarks>No duplicates allowed!</remarks>
<param name="xData">Note: Must not contain duplicate x values (use Approximation.regularizeValues to preprocess data!)</param>
<param name="yData">vector of y values</param>
<returns>vector of polynomial coefficients sorted as [constant;linear;quadratic;...]</returns>
<example><code> // e.g. days since a certain event let xData = vector [|1.;2.;3.;4.;5.;6.|] // e.g. e.g. temperature measured at noon of the days specified in xData let yData = vector [|4.;7.;9.;8.;7.;9.;|] // Estimate the polynomial coefficients. In Interpolation the order is equal to the data length - 1. let coefficients = Interpolation.Polynomial.coefficients xData yData </code></example>
<summary> takes polynomial coefficients and x value to predict the corresponding interpolating y value </summary>
<param name="coef">polynomial coefficients (e.g. determined by Polynomial.coefficients), sorted as [constant;linear;quadratic;...]</param>
<param name="x">x value of which the corresponding y value should be predicted</param>
<returns>predicted y value with given polynomial coefficients at X=x</returns>
<example><code> // e.g. days since a certain event let xData = vector [|1.;2.;3.;4.;5.;6.|] // e.g. temperature measured at noon of the days specified in xData let yData = vector [|4.;7.;9.;8.;7.;9.;|] // Estimate the polynomial coefficients. In Interpolation the order is equal to the data length - 1. let coefficients = Interpolation.Polynomial.coefficients xData yData // Predict the temperature value at midnight between day 1 and 2. Interpolation.Polynomial.fit coefficients 1.5 </code></example>
<summary> Module to create linear splines from x,y coordinates. x,y coordinates are interpolated by straight lines between two knots. </summary>
<remarks>Equivalent to interval-wise simple linear regression between any neighbouring pair of data.</remarks>
<summary> Returns the linear spline interpolation coefficients from unsorted x,y data. </summary>
<param name="xData">Collection of x values.</param>
<param name="yData">Collection of y values.</param>
<returns>x-values, intersects, and slopes of interpolating lines</returns>
<example><code> // e.g. days since a certain event let xData = vector [|0.;1.;5.;4.;3.;|] // some measured feature let yData = vector [|1.;5.;4.;13.;17.|] // get slopes and intersects for interpolating straight lines let coefficients = Interpolation.LinearSpline.interpolate xData yData </code></example>
<remarks>Must not contain duplicate x values. Use Approximation.regularizeValues to preprocess data!</remarks>
<summary> Predicts the y value at point x. A straight line is fitted between the neighboring x values given. </summary>
<param name="lsc">Linear spline coefficients given as input x values, intersects, and slopes.</param>
<param name="x">X value at which the corresponding y value should be predicted</param>
<returns>Y value corresponding to the given x value.</returns>
<example><code> // e.g. days since a certain event let xData = vector [|0.;1.;5.;4.;3.;|] // some measured feature let yData = vector [|1.;5.;4.;13.;17.|] // get slopes and intersects for interpolating straight lines let coefficients = Interpolation.LinearSpline.initInterpolate xData yData // get y value at 3.4 Interpolation.LinearSpline.interpolate coefficients 3.4 </code></example>
<remarks>X values that don't not lie within the range of the input x values, are predicted using the nearest interpolation line!</remarks>
<summary> Dash: Sets the drawing style of the lines segments in this trace. Sets the style of the lines. Set to a dash string type or a dash length in px. </summary>
static member Chart.withTitle: title: string * [<System.Runtime.InteropServices.Optional; System.Runtime.InteropServices.DefaultParameterValue ((null :> obj))>] ?TitleFont: Font -> (GenericChart.GenericChart -> GenericChart.GenericChart)
<summary> Returns function that takes x value and predicts the corresponding slope. </summary>
<param name="coefficients">Interpolation functions coefficients.</param>
<param name="x">X value of which the slope should be predicted.</param>
<returns>Function that takes an x value and returns the function slope.</returns>
<example><code> // e.g. days since a certain event let xData = vector [|0.;1.;5.;4.;3.;|] // some measured feature let yData = vector [|1.;5.;4.;13.;17.|] // get coefficients for piecewise interpolating cubic polynomials let coefficients = CubicSpline.interpolate CubicSpline.BoundaryConditions.Natural xData yData // get slope function let func = CubicSpline.getFirstDerivative(coefLinSpl) // get slope at x=3.4 func 3.4 </code></example>
<remarks>x values outside of the xValue range are predicted by straight lines defined by the nearest knot!</remarks>
<summary> Returns function that takes x value and predicts the corresponding curvature. </summary>
<param name="coefficients">Interpolation functions coefficients.</param>
<param name="x">X value of which the curvature should be predicted.</param>
<returns>Function that takes an x value and returns the function curvature.</returns>
<example><code> // e.g. days since a certain event let xData = vector [|0.;1.;5.;4.;3.;|] // some measured feature let yData = vector [|1.;5.;4.;13.;17.|] // get coefficients for piecewise interpolating cubic polynomials let coefficients = CubicSpline.interpolate CubicSpline.BoundaryConditions.Natural xData yData // get curvature function let func = CubicSpline.getSecondDerivative(coefLinSpl) // get curvature at x=3.4 func 3.4 </code></example>
<remarks>x values outside of the xValue range are predicted by straight lines defined by the nearest knot!</remarks>
<summary> Returns function that takes x value and predicts the corresponding third derivative. </summary>
<param name="coefficients">Interpolation functions coefficients.</param>
<param name="x">X value of which the y value should be predicted.</param>
<returns>Function that takes an x value and returns the function third derivative.</returns>
<example><code> // e.g. days since a certain event let xData = vector [|0.;1.;5.;4.;3.;|] // some measured feature let yData = vector [|1.;5.;4.;13.;17.|] // get coefficients for piecewise interpolating cubic polynomials let coefficients = CubicSpline.interpolate CubicSpline.BoundaryConditions.Natural xData yData // get third derivative function let func = CubicSpline.getThirdDerivative(coefLinSpl) // get third derivative at x=3.4 func 3.4 </code></example>
<remarks>x values outside of the xValue range are predicted by straight lines defined by the nearest knot!</remarks>
<summary> Module to create piecewise cubic polynomials (cubic subsplines) from x,y coordinates. Akima subsplines are more flexible than standard cubic splines because the are NOT continuous in the function curvature, thereby diminishing oscillating behaviour. </summary>
<summary> Computes coefficients for piecewise interpolating subsplines. </summary>
<param name="xValues">Note: Must not contain duplicate x values (use Approximation.regularizeValues to preprocess data!)</param>
<param name="yValues">function value at x values</param>
<returns>Coefficients that define the interpolating function.</returns>
<example><code> // e.g. days since a certain event let xData = vector [|0.;1.;5.;4.;3.;|] // some measured feature let yData = vector [|1.;5.;4.;13.;17.|] // get coefficients for piecewise interpolating cubic polynomials let coefficients = Akima.interpolate xData yData </code></example>
<remarks>Second derivative (curvature) is NOT continuous at knots to allow higher flexibility to reduce oscillations! For reference see: http://www.dorn.org/uni/sls/kap06/f08_0204.htm.</remarks>
<summary> Returns function that takes x value and predicts the corresponding interpolating y value. </summary>
<param name="splineCoeffs">Interpolation functions coefficients.</param>
<param name="xVal">X value of which the y value should be predicted.</param>
<returns>Function that takes an x value and returns function value.</returns>
<example><code> // e.g. days since a certain event let xData = vector [|0.;1.;5.;4.;3.;|] // some measured feature let yData = vector [|1.;5.;4.;13.;17.|] // get coefficients for piecewise interpolating cubic polynomials let coefficients = Akima.interpolate xData yData // get function to predict y value let interpolFunc = Akima.predict coefficients // get function value at x=3.4 interpolFunc 3.4 </code></example>
<remarks>Second derivative (curvature) is NOT continuous at knots to allow higher flexibility to reduce oscillations! For reference see: http://www.dorn.org/uni/sls/kap06/f08_0204.htm.</remarks>
<summary> Hermite cubic splines are defined by the function values and their slopes (first derivatives). If the slopws are unknown, they must be estimated. </summary>
<summary> Computes coefficients for piecewise interpolating splines. If the knots are monotone in/decreasing, the spline also is monotone (CJC Kruger method) The x data has to be sorted ascending </summary>
<param name="xData">x values</param>
<param name="yData">function value at x values</param>
<returns>Coefficients that define the interpolating function.</returns>
<example><code> // e.g. days since a certain event let xData = vector [|0.;1.;5.;4.;3.;|] // some measured feature let yData = vector [|1.;5.;6.;13.;13.1|] // get coefficients for piecewise interpolating cubic polynomials let coefficients = CubicSpline.Hermite.interpolatePreserveMonotonicity xData yData </code></example>
<remarks>Second derivative (curvature) is NOT necessarily continuous at knots to allow higher flexibility to reduce oscillations!</remarks>
<remarks>Constrained Cubic Spline Interpolation for Chemical Engineering Applications by CJC Kruger </remarks>
<summary> Returns function that takes x value and predicts the corresponding interpolating y value. </summary>
<param name="coef">Interpolation functions coefficients.</param>
<param name="x">X value of which the y value should be predicted.</param>
<returns>Function that takes an x value and returns function value.</returns>
<example><code> // e.g. days since a certain event let xData = vector [|0.;1.;5.;4.;3.;|] // some measured feature let yData = vector [|1.;5.;4.;13.;17.|] // get coefficients for piecewise interpolating cubic polynomials let coefficients = CubicSpline.Hermite.interpolate xData yData // get interpolating function let func = CubicSpline.Hermite.predict coefLinSpl // get function value at x=3.4 func 3.4 </code></example>
<remarks>x values outside of the xValue range are predicted by straight lines defined by the nearest knot!</remarks>
module Vector from FSharp.Stats
--------------------
module Vector from FsMath
--------------------
type Vector = static member add: v1: Vector<'T> -> v2: Vector<'T> -> Vector<'T> (requires 'T :> INumber<'T> and value type and default constructor and 'T :> ValueType) static member addScalar: scalar: 'T -> v: Vector<'T> -> Vector<'T> (requires 'T :> INumber<'T> and value type and default constructor and 'T :> ValueType) static member divide: v1: Vector<'T> -> v2: Vector<'T> -> Vector<'T> (requires 'T :> INumber<'T> and value type and default constructor and 'T :> ValueType) static member divideScalar: scalar: 'T -> v: Vector<'T> -> Vector<'T> (requires 'T :> INumber<'T> and value type and default constructor and 'T :> ValueType) static member dot: v1: Vector<'T> -> v2: Vector<'T> -> 'T (requires 'T :> INumber<'T> and value type and default constructor and 'T :> ValueType) static member max: v: Vector<'T> -> 'T (requires 'T :> INumber<'T> and default constructor and value type and comparison and 'T :> ValueType) static member mean: v: Vector<'T> -> 'T (requires 'T :> INumber<'T> and member DivideByInt and default constructor and value type and 'T :> ValueType) static member min: v: Vector<'T> -> 'T (requires 'T :> INumber<'T> and default constructor and value type and comparison and 'T :> ValueType) static member multiply: v1: Vector<'T> -> v2: Vector<'T> -> Vector<'T> (requires 'T :> INumber<'T> and value type and default constructor and 'T :> ValueType) static member multiplyScalar: scalar: 'T -> v: Vector<'T> -> Vector<'T> (requires 'T :> INumber<'T> and value type and default constructor and 'T :> ValueType) ...
--------------------
type Vector<'T (requires 'T :> INumber<'T>)> = 'T array
<summary> Vector as a Array type alias </summary>
val float: value: 'T -> float (requires member op_Explicit)
--------------------
type float = System.Double
--------------------
type float<'Measure> = float
<summary> Bezier interpolates data between 2 points using a number of control points, which determine the degree of the interpolated curve. </summary>
<summary> This implements Bezier interpolation using De Casteljau's algorithm. </summary>
<param name="values">an array containg the starting point, the control points, and the end point to use for interpolation</param>
<returns>The generated interpolation function</returns>
<summary> Plotly color can be a single color, a sequence of colors, or a sequence of numeric values referencing the color of the colorscale obj </summary>
static member Chart.Point3D: x: #System.IConvertible seq * y: #System.IConvertible seq * z: #System.IConvertible seq * [<System.Runtime.InteropServices.Optional; System.Runtime.InteropServices.DefaultParameterValue ((null :> obj))>] ?Name: string * [<System.Runtime.InteropServices.Optional; System.Runtime.InteropServices.DefaultParameterValue ((null :> obj))>] ?ShowLegend: bool * [<System.Runtime.InteropServices.Optional; System.Runtime.InteropServices.DefaultParameterValue ((null :> obj))>] ?Opacity: float * [<System.Runtime.InteropServices.Optional; System.Runtime.InteropServices.DefaultParameterValue ((null :> obj))>] ?MultiOpacity: float seq * [<System.Runtime.InteropServices.Optional; System.Runtime.InteropServices.DefaultParameterValue ((null :> obj))>] ?Text: 'd * [<System.Runtime.InteropServices.Optional; System.Runtime.InteropServices.DefaultParameterValue ((null :> obj))>] ?MultiText: 'd seq * [<System.Runtime.InteropServices.Optional; System.Runtime.InteropServices.DefaultParameterValue ((null :> obj))>] ?TextPosition: StyleParam.TextPosition * [<System.Runtime.InteropServices.Optional; System.Runtime.InteropServices.DefaultParameterValue ((null :> obj))>] ?MultiTextPosition: StyleParam.TextPosition seq * [<System.Runtime.InteropServices.Optional; System.Runtime.InteropServices.DefaultParameterValue ((null :> obj))>] ?MarkerColor: Color * [<System.Runtime.InteropServices.Optional; System.Runtime.InteropServices.DefaultParameterValue ((null :> obj))>] ?MarkerColorScale: StyleParam.Colorscale * [<System.Runtime.InteropServices.Optional; System.Runtime.InteropServices.DefaultParameterValue ((null :> obj))>] ?MarkerOutline: Line * [<System.Runtime.InteropServices.Optional; System.Runtime.InteropServices.DefaultParameterValue ((null :> obj))>] ?MarkerSymbol: StyleParam.MarkerSymbol3D * [<System.Runtime.InteropServices.Optional; System.Runtime.InteropServices.DefaultParameterValue ((null :> obj))>] ?MultiMarkerSymbol: StyleParam.MarkerSymbol3D seq * [<System.Runtime.InteropServices.Optional; System.Runtime.InteropServices.DefaultParameterValue ((null :> obj))>] ?Marker: TraceObjects.Marker * [<System.Runtime.InteropServices.Optional; System.Runtime.InteropServices.DefaultParameterValue ((null :> obj))>] ?CameraProjectionType: StyleParam.CameraProjectionType * [<System.Runtime.InteropServices.Optional; System.Runtime.InteropServices.DefaultParameterValue ((null :> obj))>] ?Camera: LayoutObjects.Camera * [<System.Runtime.InteropServices.Optional; System.Runtime.InteropServices.DefaultParameterValue ((null :> obj))>] ?Projection: TraceObjects.Projection * [<System.Runtime.InteropServices.Optional; System.Runtime.InteropServices.DefaultParameterValue ((true :> obj))>] ?UseDefaults: bool -> GenericChart.GenericChart (requires 'd :> System.IConvertible)
static member Chart.Line3D: x: #System.IConvertible seq * y: #System.IConvertible seq * z: #System.IConvertible seq * [<System.Runtime.InteropServices.Optional; System.Runtime.InteropServices.DefaultParameterValue ((null :> obj))>] ?ShowMarkers: bool * [<System.Runtime.InteropServices.Optional; System.Runtime.InteropServices.DefaultParameterValue ((null :> obj))>] ?Name: string * [<System.Runtime.InteropServices.Optional; System.Runtime.InteropServices.DefaultParameterValue ((null :> obj))>] ?ShowLegend: bool * [<System.Runtime.InteropServices.Optional; System.Runtime.InteropServices.DefaultParameterValue ((null :> obj))>] ?Opacity: float * [<System.Runtime.InteropServices.Optional; System.Runtime.InteropServices.DefaultParameterValue ((null :> obj))>] ?MultiOpacity: float seq * [<System.Runtime.InteropServices.Optional; System.Runtime.InteropServices.DefaultParameterValue ((null :> obj))>] ?Text: 'a3 * [<System.Runtime.InteropServices.Optional; System.Runtime.InteropServices.DefaultParameterValue ((null :> obj))>] ?MultiText: 'a3 seq * [<System.Runtime.InteropServices.Optional; System.Runtime.InteropServices.DefaultParameterValue ((null :> obj))>] ?TextPosition: StyleParam.TextPosition * [<System.Runtime.InteropServices.Optional; System.Runtime.InteropServices.DefaultParameterValue ((null :> obj))>] ?MultiTextPosition: StyleParam.TextPosition seq * [<System.Runtime.InteropServices.Optional; System.Runtime.InteropServices.DefaultParameterValue ((null :> obj))>] ?MarkerColor: Color * [<System.Runtime.InteropServices.Optional; System.Runtime.InteropServices.DefaultParameterValue ((null :> obj))>] ?MarkerColorScale: StyleParam.Colorscale * [<System.Runtime.InteropServices.Optional; System.Runtime.InteropServices.DefaultParameterValue ((null :> obj))>] ?MarkerOutline: Line * [<System.Runtime.InteropServices.Optional; System.Runtime.InteropServices.DefaultParameterValue ((null :> obj))>] ?MarkerSymbol: StyleParam.MarkerSymbol3D * [<System.Runtime.InteropServices.Optional; System.Runtime.InteropServices.DefaultParameterValue ((null :> obj))>] ?MultiMarkerSymbol: StyleParam.MarkerSymbol3D seq * [<System.Runtime.InteropServices.Optional; System.Runtime.InteropServices.DefaultParameterValue ((null :> obj))>] ?Marker: TraceObjects.Marker * [<System.Runtime.InteropServices.Optional; System.Runtime.InteropServices.DefaultParameterValue ((null :> obj))>] ?LineColor: Color * [<System.Runtime.InteropServices.Optional; System.Runtime.InteropServices.DefaultParameterValue ((null :> obj))>] ?LineColorScale: StyleParam.Colorscale * [<System.Runtime.InteropServices.Optional; System.Runtime.InteropServices.DefaultParameterValue ((null :> obj))>] ?LineWidth: float * [<System.Runtime.InteropServices.Optional; System.Runtime.InteropServices.DefaultParameterValue ((null :> obj))>] ?LineDash: StyleParam.DrawingStyle * [<System.Runtime.InteropServices.Optional; System.Runtime.InteropServices.DefaultParameterValue ((null :> obj))>] ?Line: Line * [<System.Runtime.InteropServices.Optional; System.Runtime.InteropServices.DefaultParameterValue ((null :> obj))>] ?CameraProjectionType: StyleParam.CameraProjectionType * [<System.Runtime.InteropServices.Optional; System.Runtime.InteropServices.DefaultParameterValue ((null :> obj))>] ?Camera: LayoutObjects.Camera * [<System.Runtime.InteropServices.Optional; System.Runtime.InteropServices.DefaultParameterValue ((null :> obj))>] ?Projection: TraceObjects.Projection * [<System.Runtime.InteropServices.Optional; System.Runtime.InteropServices.DefaultParameterValue ((true :> obj))>] ?UseDefaults: bool -> GenericChart.GenericChart (requires 'a3 :> System.IConvertible)
module Seq from FSharp.Stats
<summary> Module to compute common statistical measures. </summary>
--------------------
module Seq from Microsoft.FSharp.Collections
--------------------
type Seq = new: unit -> Seq static member geomspace: start: float * stop: float * num: int * ?IncludeEndpoint: bool -> float seq static member linspace: start: float * stop: float * num: int * ?IncludeEndpoint: bool -> float seq
--------------------
new: unit -> Seq
module Approximation from FSharp.Stats.InterpolationModule
<summary> Approximation </summary>
--------------------
type Approximation = new: unit -> Approximation static member approxWithPolynomial: f: (float -> float) * i: Interval<float> * n: int * spacing: Spacing -> PolynomialCoef static member approxWithPolynomialFromValues: xData: float seq * yData: float seq * n: int * spacing: Spacing -> PolynomialCoef
--------------------
new: unit -> Approximation
<summary> Creates a collection of ordered x values within a given interval. The spacing is according to Chebyshev to remove runges phenomenon when approximating a given function. </summary>
<param name="interval">start and end value of interpolation range</param>
<param name="n">number of points that should be placed within the interval (incl. start and end)</param>
<returns>Collection of chebyshev spaced x values.</returns>
<remarks>www.mscroggs.co.uk/blog/57</remarks>
module Interval from FSharp.Stats
--------------------
type Interval<'a (requires comparison)> = | Closed of intervalStart: 'a * intervalEnd: 'a | LeftOpen of intervalStart: 'a * intervalEnd: 'a | RightOpen of intervalStart: 'a * intervalEnd: 'a | Open of intervalStart: 'a * intervalEnd: 'a | Empty member Equals: Interval<'a> * IEqualityComparer -> bool member GetEnd: unit -> 'a member GetStart: unit -> 'a override ToString: unit -> string member ToTuple: unit -> 'a * 'a member liesInInterval: value: 'a -> bool static member CreateClosed<'a (requires comparison)> : min: 'a0 * max: 'a0 -> Interval<'a0> (requires comparison) static member CreateLeftOpen<'a (requires comparison)> : min: 'a0 * max: 'a0 -> Interval<'a0> (requires comparison) static member CreateOpen<'a (requires comparison)> : min: 'a0 * max: 'a0 -> Interval<'a0> (requires comparison) static member CreateRightOpen<'a (requires comparison)> : min: 'a0 * max: 'a0 -> Interval<'a0> (requires comparison) ...
<summary>Represents an interval between two values of type 'a, which can be either inclusive or exclusive.</summary>
<typeparam name="'a">The type of the interval values, must support comparison.</typeparam>
<summary> Determines polynomial coefficients to approximate the given data with (i) n equally spaced nodes or (ii) n nodes spaced according to Chebyshev. Use Polynomial.fit to get a polynomial function of the coefficients. </summary>
<param name="xData">Note: Must not contain duplicate x values (use Approximation.regularizeValues to preprocess data!)</param>
<param name="yData">vector of y values</param>
<param name="n">number of points that should be placed within the interval (incl. start and end)</param>
<param name="spacing">X values can be spaced equally or according to chebyshev.</param>
<returns>Coefficients for polynomial interpolation. Use Polynomial.fit to predict function values.</returns>