Growth curve
![]()
![]()
Summary: this tutorial demonstrates variou way to model growth curves, a commong task in any (micro)biological lab
Modelling
Growth and other physiological parameters like size/weight/length can be modeled as function of time. Several growth curve models have been proposed. Some of them are covered in this documentation.
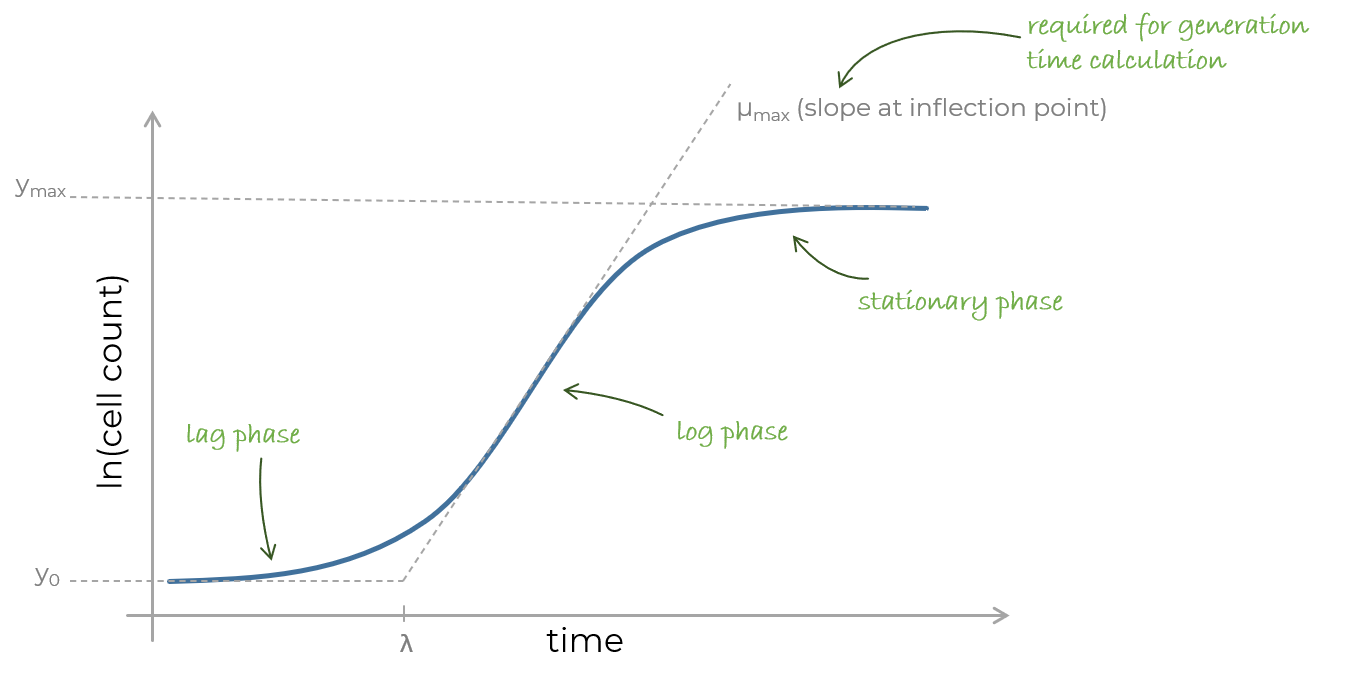
For growth curve analysis the cell count data must be considered in log space. The exponential phase (log phase) then becomes linear. After modeling, all growth parameters (maximal cell count, lag phase duration, and growth rate) can be derived from the model, so there is no need for manual labelling of separate growth phases.
If specific parameters should be constrained to the users choice (like upper or lower asymptote), a constrained version of the
Levenberg-Marquardt solver can be used (LevenbergMarquardtConstrained)! Accordingly, minimal and maximal parameter vectors must be provided.
open System
open FSharp.Stats
open FSharp.Stats.Fitting.NonLinearRegression
open FSharp.Stats.Fitting.LinearRegression

let time = [|0. .. 0.5 .. 8.|]

let cellCount =
    [|
    17000000.;16500000.;11000000.;14000000.;27000000.;40000000.;120000000.;
    300000000.;450000000.;1200000000.;2700000000.;5000000000.;
    8000000000.;11700000000.;12000000000.;13000000000.;12800000000.
    |]

let cellCountLn = cellCount |> Array.map log

open Plotly.NET

let chartOrig =
    Chart.Point(time,cellCount)
    |> Chart.withTraceInfo "original data"
    |> Chart.withTemplate ChartTemplates.lightMirrored
    |> Chart.withYAxisStyle "cells/ml"

let chartLog =
    Chart.Point(time,cellCountLn)
    |> Chart.withTraceInfo "log count"
    |> Chart.withTemplate ChartTemplates.lightMirrored
    |> Chart.withXAxisStyle "time (h)"
    |> Chart.withYAxisStyle "ln(cells/ml)"

let growthChart =
    [chartOrig;chartLog] |> Chart.Grid(2,1)
Manual phase selection
If growth phases are labelled manually, the exponential phase can be fitted with a regression line.
To determine the generation time, it is necessary to find the time interval it takes to double the count data. When a log2 transform is used, a doubling of the original counts is achieved, when the log value moves 1 unit. Keeping that in mind, the slope can be used to calculate the time it takes for the log2 data to increase 1 unit.
- slope * generation time = 1
- generation time = 1/slope
If a different log transform was used, the correction factor for the numerator is logx(2).
// The exponential phase was defined to be between time point 1.5 and 5.5.
let logPhaseX = vector time.[3..11]
let logPhaseY = vector cellCountLn.[3..11]

// regression coefficients as [intercept;slope]
let regressionCoeffs =
    OLS.Linear.Univariable.fit logPhaseX logPhaseY
Here is a pre-evaluated version (to save time during the build process, as the solver takes quite some time.)
// The generation time is calculated by dividing log_x 2. by the regression line slope.
// The log transform must match the used data transform.
let slope = regressionCoeffs.[1]
let generationTime = log(2.) / slope


let fittedValues =
    let f = OLS.Linear.Univariable.predict (Coefficients (vector [14.03859475; 1.515073487]))
    logPhaseX |> Seq.map (fun x -> x,f x)

let chartLinearRegression =
    [
    Chart.Point(time,cellCountLn)   |> Chart.withTraceInfo "log counts"
    Chart.Line(fittedValues)        |> Chart.withTraceInfo "fit"
    ]
    |> Chart.combine
    |> Chart.withTemplate ChartTemplates.lightMirrored
    |> Chart.withXAxisStyle "time (h)"
    |> Chart.withYAxisStyle "ln(cells/ml)"
let generationTimeManual = sprintf "The generation time (manual selection) is: %.1f min" ((log(2.)/1.5150)* 60.)

generationTimeManual
Gompertz model
In the following example the four parameter gompertz function is applied to cell count data (Gibson et al., 1988).
The Gompertz model is fitted using the Levenberg Marquardt solver. Initial parameters are estimated from the original data. The expected generation time has to be approximated as initial guess.
For parameter interpretation the applied log transform is important and must be provided.
If other parameters than cell count (e.g. size or length) should be analyzed, use id as value transform.
Gompertz parameters:
- A: lower asymptote
- B: relative growth rate (approximated by generation time consideration)
- C: upper asymptote - lower asymptote
- M: time point of inflection (maximal growth rate)
// The Levenberg Marquardt algorithm identifies the parameters that leads to the best fit
// of the gompertz models to the count data. The solver must be provided with initial parameters
// that are estimated in the following:
let solverOptions (xData :float []) (yDataLog :float []) expectedGenerationTime (usedLogTransform: float -> float) =
    // lower asymptote
    let a = Seq.min yDataLog
    // upper asymptote - lower asymptote (y range)
    let c = (Seq.max yDataLog) - a
    // relative growth rate
    let b = usedLogTransform 2. * Math.E / (expectedGenerationTime * c)
    // time point of inflection (in gompertz model at f(x)=36% of the y range)
    let m =
        let yAtInflection = a + c * 0.36
        Seq.zip xData yDataLog
        |> Seq.minBy (fun (xValue,yValue) ->
            Math.Abs (yValue - yAtInflection)
        )
        |> fst
    createSolverOption 0.001 0.001 10000 [|a;b;c;m|]

// By solving the nonlinear fitting problem, the optimal model parameters are determined
let gompertzParams =
    LevenbergMarquardt.estimatedParams
        Table.GrowthModels.gompertz
        (solverOptions time cellCountLn 1. log)
        0.1
        10.
        time
        cellCountLn

let fittingFunction =
    Table.GrowthModels.gompertz.GetFunctionValue gompertzParams


let fittedValuesGompertz =
    // The parameter were determined locally for saving time during build processes
    //let f = Table.GrowthModels.gompertz.GetFunctionValue (vector [|16.46850199; 0.7014917539; 7.274139441; 3.3947717|])
    [time.[0] .. 0.1 .. Seq.last time]
    |> Seq.map (fun x ->
        x,fittingFunction x
        )
    |> Chart.Line
    |> Chart.withTraceInfo "gompertz"

let fittedChartGompertz =
    [
        Chart.Point(time,cellCountLn)
        |> Chart.withTraceInfo "log count"
        fittedValuesGompertz
    ]
    |> Chart.combine
    |> Chart.withTemplate ChartTemplates.lightMirrored
    |> Chart.withXAxisStyle "time (h)"
    |> Chart.withYAxisStyle "ln(cells/ml)"
Generation time calculation
The generation time can be calculated by dividing log(2) by the slope of the inflection point. The used log transform must match the used log transform applied to the count data.
The four parameter Gompertz model allows the determination of generation times from its parameters (Gibson et al., 1988).
let generationtime (parametervector:Vector<float>) (logTransform:float -> float) =
    logTransform 2. * Math.E / (parametervector.[1] * parametervector.[2])

let lag (parametervector:Vector<float>) =
    (parametervector.[3] - 1.) / parametervector.[1]

let g = sprintf "The generation time (Gompertz) is: %.1f min" (60. * (generationtime gompertzParams log))
let l = sprintf "The lag phase duration is %.2f h" (lag gompertzParams)
|
|
Other models
In the following other growth models are applied to the given data set:
- Richards
- Weibull
- Janoschek
- Exponential
- Verhulst
- Morgan-Mercer-Flodin
- von Bertalanffy
To determine the generation time, the slope at the inflection point must be calculated. As explained above, the generation time can be calculated by: logx(2)/(slope at inflection) where x is the used log transform.
Choose a appropriate growth model according to your needs.
For an overview please scroll down to see a combined diagram of all growth models.
Richards curve
Parameters:
- l: upper asymptote
- k: growth rate
- y: inflection point (x value)
- d: influences the inflection point on the y axis
let richardsParams =
    LevenbergMarquardt.estimatedParams
        Table.GrowthModels.richards
        (createSolverOption 0.001 0.001 10000 [|23.;1.;3.4;2.|])
        0.1
        10.
        time
        cellCountLn

let fittingFunctionRichards =
    Table.GrowthModels.richards.GetFunctionValue richardsParams
Here is a pre-evaluated version (to save time during the build process, as the solver takes quite some time.)
let generationtimeRichards (richardParameters:Vector<float>) =
    let l = richardParameters.[0]
    let k = richardParameters.[1]
    let y = richardParameters.[2] //x value of inflection point
    let d = richardParameters.[3]
    let gradientFunctionRichards t =
        (k*l*((d-1.)*Math.Exp(-k*(t-y))+1.)**(1./(1.-d)))/(Math.Exp(k*(t-y))+d-1.)
    let maximalSlope =
        gradientFunctionRichards y
    log(2.) / maximalSlope

let fittedValuesRichards =
    // The parameter were determined locally for saving time during build processes
    let f =  Table.GrowthModels.richards.GetFunctionValue (vector [|23.25211263; 7.053516315; 5.646889803; 111.0132522|])
    [time.[0] .. 0.1 .. Seq.last time]
    |> Seq.map (fun x ->
        x,f x
        )
    |> Chart.Line

let fittedChartRichards =
    fittedValuesRichards
    |> Chart.withTemplate ChartTemplates.lightMirrored
    |> Chart.withXAxisStyle "time (h)"
    |> Chart.withYAxisStyle "ln(cells/ml)"
    |> Chart.withTraceInfo "richards"

let fittedChartRichardsS =
    [
        Chart.Point(time,cellCountLn)
        |> Chart.withTraceInfo "log count"
        fittedValuesRichards
    ]
    |> Chart.combine
    |> Chart.withTemplate ChartTemplates.lightMirrored
    |> Chart.withXAxisStyle "time (h)"
    |> Chart.withYAxisStyle "ln(cells/ml)"
    |> Chart.withTitle "richards"

let generationRichards = sprintf "The generation time (Richards) is: %.1f min" (generationtimeRichards (vector [|23.25211263; 7.053516315; 5.646889803; 111.0132522|]) * 60.)
|
Weibull
Parameters:
- b: lower asymptote
- l: upper asymptote
- k: growth rate
- d: influences the inflection point position
let weibullParams =
    LevenbergMarquardt.estimatedParams
        Table.GrowthModels.weibull
        (createSolverOption 0.001 0.001 10000 [|15.;25.;1.;5.|])
        0.1
        10.
        time
        cellCountLn

let fittingFunctionWeibull =
    Table.GrowthModels.weibull.GetFunctionValue weibullParams
Here is a pre-evaluated version (to save time during the build process, as the solver takes quite some time.)
let generationtimeWeibull (weibullParameters:Vector<float>) =
    let b = weibullParameters.[0]
    let l = weibullParameters.[1]
    let k = weibullParameters.[2]
    let d = weibullParameters.[3]
    let gradientFunctionWeibull t =
        (d*(l-b)*(k*t)**d*Math.Exp(-((k*t)**d)))/t
    let inflectionPointXValue =
        (1./k)*((d-1.)/d)**(1./d)
    let maximalSlope =
        gradientFunctionWeibull inflectionPointXValue
    log(2.) / maximalSlope

let fittedValuesWeibull =
    // The parameter were determined locally for saving time during build processes
    let f =  Table.GrowthModels.weibull.GetFunctionValue (vector [|16.40632433; 23.35537293; 0.2277752116; 2.900806071|])
    [time.[0] .. 0.1 .. Seq.last time]
    |> Seq.map (fun x ->
        x,f x
        )
    |> Chart.Line

let fittedChartWeibull =
    fittedValuesWeibull
    |> Chart.withTemplate ChartTemplates.lightMirrored
    |> Chart.withXAxisStyle "time (h)"
    |> Chart.withYAxisStyle "ln(cells/ml)"
    |> Chart.withTraceInfo "weibull"

let fittedChartWeibullS =
    [
        Chart.Point(time,cellCountLn)
        |> Chart.withTraceInfo "log count"
        fittedValuesWeibull
    ]
    |> Chart.combine
    |> Chart.withTemplate ChartTemplates.lightMirrored
    |> Chart.withXAxisStyle "time (h)"
    |> Chart.withYAxisStyle "ln(cells/ml)"
    |> Chart.withTitle "weibull"

let generationWeibull =
    sprintf "The generation time (Weibull) is: %.1f min" (generationtimeWeibull (vector [|16.40632433; 23.35537293; 0.2277752116; 2.900806071|]) * 60.)
|
Janoschek
Parameters:
- b: lower asymptote
- l: upper asymptote
- k: growth rate
- d: influences the inflection point position on the x axis
let janoschekParams =
    LevenbergMarquardt.estimatedParams
        Table.GrowthModels.janoschek
        (createSolverOption 0.001 0.001 10000 [|15.;25.;1.;5.|])
        0.1
        10.
        time
        cellCountLn

let fittingFunctionJanoschek =
    Table.GrowthModels.janoschek.GetFunctionValue janoschekParams
Here is a pre-evaluated version (to save time during the build process, as the solver takes quite some time.)
let generationtimeJanoschek (janoschekParameters:Vector<float>) =
    let b = janoschekParameters.[0]
    let l = janoschekParameters.[1]
    let k = janoschekParameters.[2]
    let d = janoschekParameters.[3]
    let gradientFunctionJanoschek t =
        d*k*(l-b)*t**(d-1.)*Math.Exp(-k*t**d)
    //Chart to estimate point of maximal slope (inflection point)
    let slopeChart() =
        [time.[0] .. 0.1 .. 8.] |> List.map (fun x -> x, gradientFunctionJanoschek x) |> Chart.Line
    let inflectionPointXValue =
        3.795
    let maximalSlope =
        gradientFunctionJanoschek inflectionPointXValue
    log(2.) / maximalSlope

let fittedValuesJanoschek =
    // The parameter were determined locally for saving time during build processes
    let f =  Table.GrowthModels.janoschek.GetFunctionValue (vector [|16.40633962; 23.35535182; 0.01368422994; 2.900857027|])
    [time.[0] .. 0.1 .. Seq.last time]
    |> Seq.map (fun x ->
        x,f x
        )
    |> Chart.Line

let fittedChartJanoschek =
    fittedValuesJanoschek
    |> Chart.withTemplate ChartTemplates.lightMirrored
    |> Chart.withXAxisStyle "time (h)"
    |> Chart.withYAxisStyle "ln(cells/ml)"
    |> Chart.withTraceInfo "janoschek"

let fittedChartJanoschekS =
    [
        Chart.Point(time,cellCountLn)
        |> Chart.withTraceInfo "log count"
        fittedChartJanoschek
    ]
    |> Chart.combine
    |> Chart.withTemplate ChartTemplates.lightMirrored
    |> Chart.withXAxisStyle "time (h)"
    |> Chart.withYAxisStyle "ln(cells/ml)"
    |> Chart.withTitle "janoschek"

let generationJanoschek =
    sprintf "The generation time (Janoschek) is: %.1f min" (generationtimeJanoschek (vector [|16.40633962; 23.35535182; 0.01368422994; 2.900857027|]) * 60.)
|
Exponential
The exponential model of course can not be applied to the lag phase.
Parameters:
- b: lower asymptote
- l: upper asymptote
- k: growth rate
let exponentialParams =
    LevenbergMarquardt.estimatedParams
        Table.GrowthModels.exponential
        (createSolverOption 0.001 0.001 10000 [|15.;25.;0.5|])
        0.1
        10.
        time.[6..]
        cellCountLn.[6..]

let fittingFunctionExponential =
    Table.GrowthModels.exponential.GetFunctionValue exponentialParams
Here is a pre-evaluated version (to save time during the build process, as the solver takes quite some time.)
let generationtimeExponential (expParameters:Vector<float>) =
    let b = expParameters.[0]
    let l = expParameters.[1]
    let k = expParameters.[2]
    let gradientFunctionExponential t =
        k*(l-b)*Math.Exp(-k*t)
    let maximalSlope =
        gradientFunctionExponential time.[6]
    log(2.) / maximalSlope

let fittedValuesExp =
    // The parameter were determined locally for saving time during build processes
    let f =  Table.GrowthModels.exponential.GetFunctionValue (vector [|4.813988967; 24.39950361; 0.3939132175|])
    [3.0 .. 0.1 .. Seq.last time]
    |> Seq.map (fun x ->
        x,f x
        )
    |> Chart.Line

let fittedChartExp =
    fittedValuesExp
    |> Chart.withTemplate ChartTemplates.lightMirrored
    |> Chart.withXAxisStyle "time (h)"
    |> Chart.withYAxisStyle "ln(cells/ml)"
    |> Chart.withTraceInfo "exponential"

let fittedChartExpS =
    [
        Chart.Point(time,cellCountLn)
        |> Chart.withTraceInfo "log count"
        fittedChartExp
    ]
    |> Chart.combine
    |> Chart.withTemplate ChartTemplates.lightMirrored
    |> Chart.withXAxisStyle "time (h)"
    |> Chart.withYAxisStyle "ln(cells/ml)"
    |> Chart.withTitle "exponential"

let generationExponential =
    sprintf "The generation time (Exp) is: %.1f min" (generationtimeExponential (vector [|4.813988967; 24.39950361; 0.3939132175|]) * 60.)
|
Verhulst
The verhulst growth model is a logistic function with a lower asymptote fixed at y=0. A 4 parameter version allows the lower asymptote to vary from 0.
Note: symmetric with inflection point at 50 % of y axis range
Parameters:
- l: upper asymptote
- k: x value at inflection point
- d: steepness
- b: lower asymptote
To apply the 3 parameter verhulst model with a fixed lower asymptote = 0 use the 'verhulst' model instead of 'verhulst4Param'.
let verhulstParams =
    LevenbergMarquardt.estimatedParams
        Table.GrowthModels.verhulst4Param
        (createSolverOption 0.001 0.001 10000 [|25.;3.5;1.;15.|])
        0.1
        10.
        time
        cellCountLn

let fittingFunctionVerhulst() =
    Table.GrowthModels.verhulst.GetFunctionValue verhulstParams
Here is a pre-evaluated version (to save time during the build process, as the solver takes quite some time.)
let generationtimeVerhulst (verhulstParameters:Vector<float>) =
    let lmax = verhulstParameters.[0]
    let k    = verhulstParameters.[1]
    let d    = verhulstParameters.[2]
    let lmin = verhulstParameters.[3]
    let gradientFunctionVerhulst t =
        ((lmax-lmin)*Math.Exp((k-t)/d))/(d*(Math.Exp((k-t)/d)+1.)**2.)
    let maximalSlope =
        gradientFunctionVerhulst k
    log(2.) / maximalSlope

let fittedValuesVerhulst =
    // The parameter were determined locally for saving time during build processes
    let f =  Table.GrowthModels.verhulst4Param.GetFunctionValue (vector [|23.39504328; 3.577488116; 1.072136278; 15.77380824|])
    [time.[0] .. 0.1 .. Seq.last time]
    |> Seq.map (fun x ->
        x,f x
        )
    |> Chart.Line

let fittedChartVerhulst =
    fittedValuesVerhulst
    |> Chart.withTemplate ChartTemplates.lightMirrored
    |> Chart.withXAxisStyle "time (h)"
    |> Chart.withYAxisStyle "ln(cells/ml)"
    |> Chart.withTraceInfo "verhulst"

let fittedChartVerhulstS =
    [
        Chart.Point(time,cellCountLn)
        |> Chart.withTraceInfo "log count"
        fittedChartVerhulst
    ]
    |> Chart.combine
    |> Chart.withTemplate ChartTemplates.lightMirrored
    |> Chart.withXAxisStyle "time (h)"
    |> Chart.withYAxisStyle "ln(cells/ml)"
    |> Chart.withTitle "verhulst"

let generationVerhulst =
    sprintf "The generation time (Verhulst) is: %.1f min" (generationtimeVerhulst (vector [|23.39504328; 3.577488116; 1.072136278; 15.77380824|]) * 60.)
|
Morgan-Mercer-Flodin
Parameters:
- b: count at t0
- l: upper asymptote
- k: growth rate
- d: influences the inflection point position
let morganMercerFlodinParams =
    LevenbergMarquardt.estimatedParams
        Table.GrowthModels.morganMercerFlodin
        (createSolverOption 0.001 0.001 10000 [|15.;25.;0.2;3.|])
        0.1
        10.
        time
        cellCountLn

let fittingFunctionMMF() =
    Table.GrowthModels.morganMercerFlodin.GetFunctionValue morganMercerFlodinParams
Here is a pre-evaluated version (to save time during the build process, as the solver takes quite some time.)
let generationtimeMmf (mmfParameters:Vector<float>) =
    let b = mmfParameters.[0]
    let l = mmfParameters.[1]
    let k = mmfParameters.[2]
    let d = mmfParameters.[3]
    let gradientFunctionMmf t =
        (d*(l-b)*(k*t)**d)/(t*((k*t)**d+1.)**2.)
    //Chart to estimate point of maximal slope (inflection point)
    let slopeChart() =
        [time.[0] .. 0.1 .. 8.] |> List.map (fun x -> x, gradientFunctionMmf x) |> Chart.Line
    let inflectionPointXValue =
        3.45
    let maximalSlope =
        gradientFunctionMmf inflectionPointXValue
    log(2.) / maximalSlope

let generationMmf =
    sprintf "The generation time (MMF) is: %.1f min" (generationtimeMmf (vector [|16.46099291; 24.00147463; 0.2500698772; 3.741048641|]) * 60.)

let fittedValuesMMF =
    // The parameter were determined locally for saving time during build processes
    let f =  Table.GrowthModels.morganMercerFlodin.GetFunctionValue (vector [|16.46099291; 24.00147463; 0.2500698772; 3.741048641|])
    [time.[0] .. 0.1 .. Seq.last time]
    |> Seq.map (fun x ->
        x,f x
        )
    |> Chart.Line

let fittedChartMMF =
    [
        Chart.Point(time,cellCountLn)
        |> Chart.withTraceInfo "log count"
        fittedValuesMMF |> Chart.withTraceInfo "morganMercerFlodin"
    ]
    |> Chart.combine
    |> Chart.withTemplate ChartTemplates.lightMirrored
    |> Chart.withXAxisStyle "time (h)"
    |> Chart.withYAxisStyle "ln(cells/ml)"
    |> Chart.withTitle "morganMercerFlodin"
|
von Bertalanffy
Since this model expects a x axis crossing of the data it cannot be applied to the given data.
Parameters:
- l: upper asymptote
- k: growth rate
- t0: x axis crossing
Comparison between all models
Fit function
let combinedGrowthChart =
    [

        Chart.Point(time,cellCountLn) |> Chart.withTraceInfo "log count"
        Chart.Line(fittedValues)|> Chart.withTraceInfo "regression line"
        fittedValuesGompertz    |> Chart.withTraceInfo "Gompertz"
        fittedValuesRichards    |> Chart.withTraceInfo "Richards"
        fittedValuesWeibull     |> Chart.withTraceInfo "Weibull"
        fittedValuesJanoschek   |> Chart.withTraceInfo "Janoschek"
        fittedValuesExp         |> Chart.withTraceInfo "Exponential"
        fittedValuesVerhulst    |> Chart.withTraceInfo "Verhulst"
        fittedValuesMMF         |> Chart.withTraceInfo "MorganMercerFlodin"
    ]
    |> Chart.combine
    |> Chart.withTemplate ChartTemplates.lightMirrored
    |> Chart.withXAxisStyle "time (h)"
    |> Chart.withYAxisStyle "ln(cells/ml)"
Generation time
let generationTimeTable =
    let header = ["<b>Model</b>";"<b>Generation time (min)"]
    let rows =
        [
            ["manual selection (regression line)";      sprintf "%.1f" ((log(2.)/1.5150)* 60.)]
            ["Gompertz";    sprintf "%.1f" (60. * (generationtime gompertzParams log))]
            ["Richards";    sprintf "%.1f" (generationtimeRichards (vector [|23.25211263; 7.053516315; 5.646889803; 111.0132522|]) * 60.)]
            ["Weibull";     sprintf "%.1f" (generationtimeWeibull (vector [|16.40632433; 23.35537293; 0.2277752116; 2.900806071|]) * 60.)  ]
            ["Janoschek";   sprintf "%.1f" (generationtimeJanoschek (vector [|16.40633962; 23.35535182; 0.01368422994; 2.900857027|]) * 60.)]
            ["Exponential"; sprintf "%.1f" (generationtimeExponential (vector [|4.813988967; 24.39950361; 0.3939132175|]) * 60.)]
            ["Verhulst";    sprintf "%.1f" (generationtimeVerhulst (vector [|23.39504328; 3.577488116; 1.072136278; 15.77380824|]) * 60.)]
            ["MMF";         sprintf "%.1f" (generationtimeMmf (vector [|16.46099291; 24.00147463; 0.2500698772; 3.741048641|]) * 60.)]
        ]

    Chart.Table(
        header,
        rows,
        HeaderFillColor = Color.fromHex "#45546a",
        CellsFillColor = Color.fromColors [Color.fromHex "#deebf7";Color.fromString "lightgrey"]
        )
Model examples
<summary> Contains mutable global default values. Changing these values will apply the default values to all consecutive Chart generations. </summary>
type DisplayOptions = inherit DynamicObj new: unit -> DisplayOptions static member addAdditionalHeadTags: additionalHeadTags: XmlNode list -> (DisplayOptions -> DisplayOptions) static member addDescription: description: XmlNode list -> (DisplayOptions -> DisplayOptions) static member combine: first: DisplayOptions -> second: DisplayOptions -> DisplayOptions static member getAdditionalHeadTags: displayOpts: DisplayOptions -> XmlNode list static member getDescription: displayOpts: DisplayOptions -> XmlNode list static member getPlotlyReference: displayOpts: DisplayOptions -> PlotlyJSReference static member init: [<Optional; DefaultParameterValue ((null :> obj))>] ?AdditionalHeadTags: XmlNode list * [<Optional; DefaultParameterValue ((null :> obj))>] ?Description: XmlNode list * [<Optional; DefaultParameterValue ((null :> obj))>] ?PlotlyJSReference: PlotlyJSReference -> DisplayOptions static member initCDNOnly: unit -> DisplayOptions ...
--------------------
new: unit -> Plotly.NET.DisplayOptions
<summary> Sets how plotly is referenced in the head of html docs. </summary>
namespace FSharp
--------------------
namespace Microsoft.FSharp
module LinearRegression from FSharp.Stats.Fitting
<summary> Linear regression is used to estimate the relationship of one variable (y) with another (x) by expressing y in terms of a linear function of x. </summary>
--------------------
type LinearRegression = new: unit -> LinearRegression static member fit: xData: Vector<float> * yData: Vector<float> * ?FittingMethod: Method * ?Constraint: Constraint<float * float> * ?Weighting: Vector<float> -> Coefficients + 1 overload static member predict: coeff: Coefficients -> xValue: float -> float static member predictMultivariate: coeff: Coefficients -> xVector: Vector<float> -> float
<summary> This LinearRegression type summarized the most common fitting procedures. </summary>
<returns>Either linear regression coefficients or a prediction function to map x values/vectors to its corresponding y value.</returns>
<example><code> // e.g. days since experiment start let xData = vector [|1. .. 100.|] // e.g. plant size in cm let yData = vector [|4.;7.;8.;9.;7.;11.; ...|] // Estimate the intercept and slope of a line, that fits the data. let coefficientsSimpleLinear = LinearRegression.fit(xData,yData,FittingMethod=Fitting.Method.SimpleLinear,Constraint=Fitting.Constraint.RegressionThroughOrigin) // Predict the size on day 10.5 LinearRegression.predict(coefficientsSimpleLinear) 10.5 </code></example>
--------------------
new: unit -> Fitting.LinearRegression
type Array = new: unit -> Array static member geomspace: start: float * stop: float * num: int * ?IncludeEndpoint: bool -> float array static member linspace: start: float * stop: float * num: int * ?IncludeEndpoint: bool -> float array
--------------------
new: unit -> Array
static member Chart.Point: x: #IConvertible seq * y: #IConvertible seq * [<Runtime.InteropServices.Optional; Runtime.InteropServices.DefaultParameterValue ((null :> obj))>] ?Name: string * [<Runtime.InteropServices.Optional; Runtime.InteropServices.DefaultParameterValue ((null :> obj))>] ?ShowLegend: bool * [<Runtime.InteropServices.Optional; Runtime.InteropServices.DefaultParameterValue ((null :> obj))>] ?Opacity: float * [<Runtime.InteropServices.Optional; Runtime.InteropServices.DefaultParameterValue ((null :> obj))>] ?MultiOpacity: float seq * [<Runtime.InteropServices.Optional; Runtime.InteropServices.DefaultParameterValue ((null :> obj))>] ?Text: 'c * [<Runtime.InteropServices.Optional; Runtime.InteropServices.DefaultParameterValue ((null :> obj))>] ?MultiText: 'c seq * [<Runtime.InteropServices.Optional; Runtime.InteropServices.DefaultParameterValue ((null :> obj))>] ?TextPosition: StyleParam.TextPosition * [<Runtime.InteropServices.Optional; Runtime.InteropServices.DefaultParameterValue ((null :> obj))>] ?MultiTextPosition: StyleParam.TextPosition seq * [<Runtime.InteropServices.Optional; Runtime.InteropServices.DefaultParameterValue ((null :> obj))>] ?MarkerColor: Color * [<Runtime.InteropServices.Optional; Runtime.InteropServices.DefaultParameterValue ((null :> obj))>] ?MarkerColorScale: StyleParam.Colorscale * [<Runtime.InteropServices.Optional; Runtime.InteropServices.DefaultParameterValue ((null :> obj))>] ?MarkerOutline: Line * [<Runtime.InteropServices.Optional; Runtime.InteropServices.DefaultParameterValue ((null :> obj))>] ?MarkerSymbol: StyleParam.MarkerSymbol * [<Runtime.InteropServices.Optional; Runtime.InteropServices.DefaultParameterValue ((null :> obj))>] ?MultiMarkerSymbol: StyleParam.MarkerSymbol seq * [<Runtime.InteropServices.Optional; Runtime.InteropServices.DefaultParameterValue ((null :> obj))>] ?Marker: TraceObjects.Marker * [<Runtime.InteropServices.Optional; Runtime.InteropServices.DefaultParameterValue ((null :> obj))>] ?AlignmentGroup: string * [<Runtime.InteropServices.Optional; Runtime.InteropServices.DefaultParameterValue ((null :> obj))>] ?OffsetGroup: string * [<Runtime.InteropServices.Optional; Runtime.InteropServices.DefaultParameterValue ((null :> obj))>] ?StackGroup: string * [<Runtime.InteropServices.Optional; Runtime.InteropServices.DefaultParameterValue ((null :> obj))>] ?Orientation: StyleParam.Orientation * [<Runtime.InteropServices.Optional; Runtime.InteropServices.DefaultParameterValue ((null :> obj))>] ?GroupNorm: StyleParam.GroupNorm * [<Runtime.InteropServices.Optional; Runtime.InteropServices.DefaultParameterValue ((false :> obj))>] ?UseWebGL: bool * [<Runtime.InteropServices.Optional; Runtime.InteropServices.DefaultParameterValue ((true :> obj))>] ?UseDefaults: bool -> GenericChart.GenericChart (requires 'c :> IConvertible)
static member Chart.Grid: nRows: int * nCols: int * [<Runtime.InteropServices.Optional; Runtime.InteropServices.DefaultParameterValue ((null :> obj))>] ?SubPlots: (StyleParam.LinearAxisId * StyleParam.LinearAxisId) array array * [<Runtime.InteropServices.Optional; Runtime.InteropServices.DefaultParameterValue ((null :> obj))>] ?XAxes: StyleParam.LinearAxisId array * [<Runtime.InteropServices.Optional; Runtime.InteropServices.DefaultParameterValue ((null :> obj))>] ?YAxes: StyleParam.LinearAxisId array * [<Runtime.InteropServices.Optional; Runtime.InteropServices.DefaultParameterValue ((null :> obj))>] ?RowOrder: StyleParam.LayoutGridRowOrder * [<Runtime.InteropServices.Optional; Runtime.InteropServices.DefaultParameterValue ((null :> obj))>] ?Pattern: StyleParam.LayoutGridPattern * [<Runtime.InteropServices.Optional; Runtime.InteropServices.DefaultParameterValue ((null :> obj))>] ?XGap: float * [<Runtime.InteropServices.Optional; Runtime.InteropServices.DefaultParameterValue ((null :> obj))>] ?YGap: float * [<Runtime.InteropServices.Optional; Runtime.InteropServices.DefaultParameterValue ((null :> obj))>] ?Domain: LayoutObjects.Domain * [<Runtime.InteropServices.Optional; Runtime.InteropServices.DefaultParameterValue ((null :> obj))>] ?XSide: StyleParam.LayoutGridXSide * [<Runtime.InteropServices.Optional; Runtime.InteropServices.DefaultParameterValue ((null :> obj))>] ?YSide: StyleParam.LayoutGridYSide -> (#(GenericChart.GenericChart seq) -> GenericChart.GenericChart)
<summary> Module to represent a GenericChart </summary>
<summary> Ordinary Least Squares (OLS) regression aims to minimise the sum of squared y intercepts between the original and predicted points at each x value. </summary>
<summary> Simple linear regression using straight lines: f(x) = a + bx. </summary>
<summary> Univariable handles two dimensional x,y data. </summary>
<summary> Calculates the intercept and slope for a straight line fitting the data. Linear regression minimizes the sum of squared residuals. </summary>
<param name="xData">vector of x values</param>
<param name="yData">vector of y values</param>
<returns>vector of [intercept; slope]</returns>
<example><code> // e.g. days since a certain event let xData = vector [|1.;2.;3.;4.;5.;6.|] // e.g. some measured feature let yData = vector [|4.;7.;9.;10.;11.;15.|] // Estimate the coefficients of a straight line fitting the given data let coefficients = Univariable.fit xData yData </code></example>
<summary> Takes intercept and slope of simple linear regression to predict the corresponding y value. </summary>
<param name="coef">vector of [intercept;slope] (e.g. determined by Univariable.coefficient)</param>
<param name="x">x value of which the corresponding y value should be predicted</param>
<returns>predicted y value with given coefficients at X=x</returns>
<example><code> // e.g. days since a certain event let xData = vector [|1.;2.;3.;4.;5.;6.|] // e.g. some measured feature let yData = vector [|4.;7.;9.;10.;11.;15.|] // Estimate the coefficients of a straight line fitting the given data let coefficients = Univariable.fit xData yData // Predict the feature at midnight between day 1 and 2. Univariable.predict coefficients 1.5 </code></example>
type Coefficients = new: coefficients: Vector<float> -> Coefficients member Item: degree: int -> float member Predict: x: float -> float + 1 overload override ToString: unit -> string member getCoefficient: degree: int -> float static member Empty: unit -> Coefficients static member Init: coefficients: Vector<float> -> Coefficients member Coefficients: Vector<float> member Constant: float member Count: int ...
<summary> Polynomial coefficients with various properties are stored within this type. </summary>
--------------------
new: coefficients: Vector<float> -> Coefficients
module Seq from FSharp.Stats
<summary> Module to compute common statistical measures. </summary>
--------------------
module Seq from Microsoft.FSharp.Collections
--------------------
type Seq = new: unit -> Seq static member geomspace: start: float * stop: float * num: int * ?IncludeEndpoint: bool -> float seq static member linspace: start: float * stop: float * num: int * ?IncludeEndpoint: bool -> float seq
--------------------
new: unit -> Seq
static member Chart.Line: x: #IConvertible seq * y: #IConvertible seq * [<Runtime.InteropServices.Optional; Runtime.InteropServices.DefaultParameterValue ((null :> obj))>] ?ShowMarkers: bool * [<Runtime.InteropServices.Optional; Runtime.InteropServices.DefaultParameterValue ((null :> obj))>] ?Name: string * [<Runtime.InteropServices.Optional; Runtime.InteropServices.DefaultParameterValue ((null :> obj))>] ?ShowLegend: bool * [<Runtime.InteropServices.Optional; Runtime.InteropServices.DefaultParameterValue ((null :> obj))>] ?Opacity: float * [<Runtime.InteropServices.Optional; Runtime.InteropServices.DefaultParameterValue ((null :> obj))>] ?MultiOpacity: float seq * [<Runtime.InteropServices.Optional; Runtime.InteropServices.DefaultParameterValue ((null :> obj))>] ?Text: 'a2 * [<Runtime.InteropServices.Optional; Runtime.InteropServices.DefaultParameterValue ((null :> obj))>] ?MultiText: 'a2 seq * [<Runtime.InteropServices.Optional; Runtime.InteropServices.DefaultParameterValue ((null :> obj))>] ?TextPosition: StyleParam.TextPosition * [<Runtime.InteropServices.Optional; Runtime.InteropServices.DefaultParameterValue ((null :> obj))>] ?MultiTextPosition: StyleParam.TextPosition seq * [<Runtime.InteropServices.Optional; Runtime.InteropServices.DefaultParameterValue ((null :> obj))>] ?MarkerColor: Color * [<Runtime.InteropServices.Optional; Runtime.InteropServices.DefaultParameterValue ((null :> obj))>] ?MarkerColorScale: StyleParam.Colorscale * [<Runtime.InteropServices.Optional; Runtime.InteropServices.DefaultParameterValue ((null :> obj))>] ?MarkerOutline: Line * [<Runtime.InteropServices.Optional; Runtime.InteropServices.DefaultParameterValue ((null :> obj))>] ?MarkerSymbol: StyleParam.MarkerSymbol * [<Runtime.InteropServices.Optional; Runtime.InteropServices.DefaultParameterValue ((null :> obj))>] ?MultiMarkerSymbol: StyleParam.MarkerSymbol seq * [<Runtime.InteropServices.Optional; Runtime.InteropServices.DefaultParameterValue ((null :> obj))>] ?Marker: TraceObjects.Marker * [<Runtime.InteropServices.Optional; Runtime.InteropServices.DefaultParameterValue ((null :> obj))>] ?LineColor: Color * [<Runtime.InteropServices.Optional; Runtime.InteropServices.DefaultParameterValue ((null :> obj))>] ?LineColorScale: StyleParam.Colorscale * [<Runtime.InteropServices.Optional; Runtime.InteropServices.DefaultParameterValue ((null :> obj))>] ?LineWidth: float * [<Runtime.InteropServices.Optional; Runtime.InteropServices.DefaultParameterValue ((null :> obj))>] ?LineDash: StyleParam.DrawingStyle * [<Runtime.InteropServices.Optional; Runtime.InteropServices.DefaultParameterValue ((null :> obj))>] ?Line: Line * [<Runtime.InteropServices.Optional; Runtime.InteropServices.DefaultParameterValue ((null :> obj))>] ?AlignmentGroup: string * [<Runtime.InteropServices.Optional; Runtime.InteropServices.DefaultParameterValue ((null :> obj))>] ?OffsetGroup: string * [<Runtime.InteropServices.Optional; Runtime.InteropServices.DefaultParameterValue ((null :> obj))>] ?StackGroup: string * [<Runtime.InteropServices.Optional; Runtime.InteropServices.DefaultParameterValue ((null :> obj))>] ?Orientation: StyleParam.Orientation * [<Runtime.InteropServices.Optional; Runtime.InteropServices.DefaultParameterValue ((null :> obj))>] ?GroupNorm: StyleParam.GroupNorm * [<Runtime.InteropServices.Optional; Runtime.InteropServices.DefaultParameterValue ((null :> obj))>] ?Fill: StyleParam.Fill * [<Runtime.InteropServices.Optional; Runtime.InteropServices.DefaultParameterValue ((null :> obj))>] ?FillColor: Color * [<Runtime.InteropServices.Optional; Runtime.InteropServices.DefaultParameterValue ((null :> obj))>] ?FillPattern: TraceObjects.Pattern * [<Runtime.InteropServices.Optional; Runtime.InteropServices.DefaultParameterValue ((false :> obj))>] ?UseWebGL: bool * [<Runtime.InteropServices.Optional; Runtime.InteropServices.DefaultParameterValue ((true :> obj))>] ?UseDefaults: bool -> GenericChart.GenericChart (requires 'a2 :> IConvertible)
val float: value: 'T -> float (requires member op_Explicit)
--------------------
type float = Double
--------------------
type float<'Measure> = float
<summary>Provides constants and static methods for trigonometric, logarithmic, and other common mathematical functions.</summary>
<summary>Represents the natural logarithmic base, specified by the constant, <see langword="e" />.</summary>
Math.Abs(value: sbyte) : sbyte
Math.Abs(value: nativeint) : nativeint
Math.Abs(value: int64) : int64
Math.Abs(value: int) : int
Math.Abs(value: int16) : int16
Math.Abs(value: float) : float
Math.Abs(value: decimal) : decimal
<summary>Returns a parameter vector as a possible solution for least square based nonlinear fitting of a given dataset (xData, yData) with a given <br />model function. </summary>
<remarks></remarks>
<param name="model"></param>
<param name="solverOptions"></param>
<param name="lambdaInitial"></param>
<param name="lambdaFactor"></param>
<param name="xData"></param>
<param name="yData"></param>
<returns></returns>
<example><code></code></example>
module Table from FSharp.Stats.Fitting.NonLinearRegression
--------------------
type Table<'R,'C,'T (requires comparison and comparison and 'T :> INumber<'T> and default constructor and value type and comparison and 'T :> ValueType)> = new: rowKeys: 'R array * colKeys: 'C array * dataMatrix: Matrix<'T> -> Table<'R,'C,'T> member GetColumn: c: 'C -> ('R * 'T) array member GetRow: r: 'R -> ('C * 'T) array override ToString: unit -> string member ColKeys: 'C array member Data: Vector<'T> member DataMatrix: Matrix<'T> member Item: r: 'R * c: 'C -> 'T with get member Item: r: 'R * c: 'C -> 'T with set member Item: i: int * j: int -> 'T with get ...
<summary> A 2D table with generic row‐labels and column‐labels, backed by a flattened Matrix<'T> </summary>
--------------------
new: rowKeys: 'R array * colKeys: 'C array * dataMatrix: Matrix<'T> -> Table<'R,'C,'T>
<summary> The gompertz function describes the log cell count at time point t. </summary>
module Vector from FSharp.Stats
--------------------
module Vector from FsMath
--------------------
type Vector = static member add: v1: Vector<'T> -> v2: Vector<'T> -> Vector<'T> (requires 'T :> INumber<'T> and value type and default constructor and 'T :> ValueType) static member addScalar: scalar: 'T -> v: Vector<'T> -> Vector<'T> (requires 'T :> INumber<'T> and value type and default constructor and 'T :> ValueType) static member divide: v1: Vector<'T> -> v2: Vector<'T> -> Vector<'T> (requires 'T :> INumber<'T> and value type and default constructor and 'T :> ValueType) static member divideScalar: scalar: 'T -> v: Vector<'T> -> Vector<'T> (requires 'T :> INumber<'T> and value type and default constructor and 'T :> ValueType) static member dot: v1: Vector<'T> -> v2: Vector<'T> -> 'T (requires 'T :> INumber<'T> and value type and default constructor and 'T :> ValueType) static member max: v: Vector<'T> -> 'T (requires 'T :> INumber<'T> and default constructor and value type and comparison and 'T :> ValueType) static member mean: v: Vector<'T> -> 'T (requires 'T :> INumber<'T> and member DivideByInt and default constructor and value type and 'T :> ValueType) static member min: v: Vector<'T> -> 'T (requires 'T :> INumber<'T> and default constructor and value type and comparison and 'T :> ValueType) static member multiply: v1: Vector<'T> -> v2: Vector<'T> -> Vector<'T> (requires 'T :> INumber<'T> and value type and default constructor and 'T :> ValueType) static member multiplyScalar: scalar: 'T -> v: Vector<'T> -> Vector<'T> (requires 'T :> INumber<'T> and value type and default constructor and 'T :> ValueType) ...
--------------------
type Vector<'T (requires 'T :> INumber<'T>)> = 'T array
<summary> Vector as a Array type alias </summary>
<summary> 4 parameter richards curve with minimum at 0; d &lt;&gt; 1 </summary>
static member Chart.withTitle: title: string * [<Runtime.InteropServices.Optional; Runtime.InteropServices.DefaultParameterValue ((null :> obj))>] ?TitleFont: Font -> (GenericChart.GenericChart -> GenericChart.GenericChart)
<summary> weibull growth model; if d=1 then it is a simple exponential growth model </summary>
<summary> stable growth model similar to weibull model </summary>
module List from FSharp.Stats
<summary> Module to compute common statistical measure on list </summary>
--------------------
module List from Microsoft.FSharp.Collections
--------------------
type List = new: unit -> List static member geomspace: start: float * stop: float * num: int * ?IncludeEndpoint: bool -> float list static member linspace: start: float * stop: float * num: int * ?IncludeEndpoint: bool -> float list
--------------------
type List<'T> = | op_Nil | op_ColonColon of Head: 'T * Tail: 'T list interface IReadOnlyList<'T> interface IReadOnlyCollection<'T> interface IEnumerable interface IEnumerable<'T> member GetReverseIndex: rank: int * offset: int -> int member GetSlice: startIndex: int option * endIndex: int option -> 'T list static member Cons: head: 'T * tail: 'T list -> 'T list member Head: 'T member IsEmpty: bool member Item: index: int -> 'T with get ...
--------------------
new: unit -> List
<summary> exponential growth model </summary>
<summary> 4 parameter verhulst model with variably lowers asymptote </summary>
<summary> 3 parameter verhulst logistic model with lower asymptote=0 </summary>
<summary> 4 parameter Morgan-Mercer-Flodin growth model </summary>
static member Chart.Table: headerValues: #('b seq) seq * cellsValues: #('d seq) seq * [<Runtime.InteropServices.Optional; Runtime.InteropServices.DefaultParameterValue ((true :> obj))>] ?TransposeCells: bool * [<Runtime.InteropServices.Optional; Runtime.InteropServices.DefaultParameterValue ((null :> obj))>] ?HeaderAlign: StyleParam.HorizontalAlign * [<Runtime.InteropServices.Optional; Runtime.InteropServices.DefaultParameterValue ((null :> obj))>] ?HeaderMultiAlign: StyleParam.HorizontalAlign seq * [<Runtime.InteropServices.Optional; Runtime.InteropServices.DefaultParameterValue ((null :> obj))>] ?HeaderFillColor: Color * [<Runtime.InteropServices.Optional; Runtime.InteropServices.DefaultParameterValue ((null :> obj))>] ?HeaderHeight: int * [<Runtime.InteropServices.Optional; Runtime.InteropServices.DefaultParameterValue ((null :> obj))>] ?HeaderOutlineColor: Color * [<Runtime.InteropServices.Optional; Runtime.InteropServices.DefaultParameterValue ((null :> obj))>] ?HeaderOutlineWidth: float * [<Runtime.InteropServices.Optional; Runtime.InteropServices.DefaultParameterValue ((null :> obj))>] ?HeaderOutlineMultiWidth: float seq * [<Runtime.InteropServices.Optional; Runtime.InteropServices.DefaultParameterValue ((null :> obj))>] ?HeaderOutline: Line * [<Runtime.InteropServices.Optional; Runtime.InteropServices.DefaultParameterValue ((null :> obj))>] ?CellsAlign: StyleParam.HorizontalAlign * [<Runtime.InteropServices.Optional; Runtime.InteropServices.DefaultParameterValue ((null :> obj))>] ?CellsMultiAlign: StyleParam.HorizontalAlign seq * [<Runtime.InteropServices.Optional; Runtime.InteropServices.DefaultParameterValue ((null :> obj))>] ?CellsFillColor: Color * [<Runtime.InteropServices.Optional; Runtime.InteropServices.DefaultParameterValue ((null :> obj))>] ?CellsHeight: int * [<Runtime.InteropServices.Optional; Runtime.InteropServices.DefaultParameterValue ((null :> obj))>] ?CellsOutlineColor: Color * [<Runtime.InteropServices.Optional; Runtime.InteropServices.DefaultParameterValue ((null :> obj))>] ?CellsOutlineWidth: float * [<Runtime.InteropServices.Optional; Runtime.InteropServices.DefaultParameterValue ((null :> obj))>] ?CellsOutlineMultiWidth: float seq * [<Runtime.InteropServices.Optional; Runtime.InteropServices.DefaultParameterValue ((null :> obj))>] ?CellsOutline: Line * [<Runtime.InteropServices.Optional; Runtime.InteropServices.DefaultParameterValue ((null :> obj))>] ?Name: string * [<Runtime.InteropServices.Optional; Runtime.InteropServices.DefaultParameterValue ((null :> obj))>] ?ColumnOrder: int seq * [<Runtime.InteropServices.Optional; Runtime.InteropServices.DefaultParameterValue ((null :> obj))>] ?ColumnWidth: float * [<Runtime.InteropServices.Optional; Runtime.InteropServices.DefaultParameterValue ((null :> obj))>] ?MultiColumnWidth: float seq * [<Runtime.InteropServices.Optional; Runtime.InteropServices.DefaultParameterValue ((true :> obj))>] ?UseDefaults: bool -> GenericChart.GenericChart (requires 'b :> IConvertible and 'd :> IConvertible)
<summary> Plotly color can be a single color, a sequence of colors, or a sequence of numeric values referencing the color of the colorscale obj </summary>
<summary> originally GetValue; contains function body </summary>
<summary> Generalized logistic function or curve, also known as Richards' curve with 7 parameters. Logistic function of the form "Y(t) = A + (K - A) / (C + Q * e^(-B * (t - M)))**(1. / v)" </summary>
<summary> 3 parameter von Bertalanffy growth model </summary>