FSharp.Charting: BoxPlot Charts
Summary: This example shows how to create boxplot diagrams in F#. It looks at how to create a single boxplot from six statistics about an observation set as well as how to automatically create boxplots from observations.
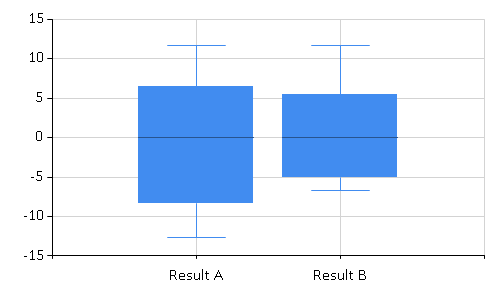
When creating boxplot charts, it is possible to use either six statistics (Lower whisker, Upper whisker, Lower box, Upper box, Average, Median) that define the boxplot data, or to infer these statistics from a set of values and let the library generate the boxplot diagram automatically.
A boxplot diagram shows six basic statistics about a set of observations. It displays the
dataset minimum and maximum, the upper and lower quartiles, the average value, and the
median. When the F# script calculates these six statistics, the values can be passed to
the method Chart.BoxPlotFromStatistics as a list of tuples
to draw multiple boxplots.
1: 2: 3: 4: 5: 6: |
|
1: 2: 3: |
|
Here is the same box plot with dates used as labels. These must be explicitly formatted as strings.
1: 2: 3: 4: |
|

This snippet calls the Chart.BoxPlotFromStatistics method with a list containing
(Label, Lower whisker, Upper whisker, Lower box, Upper box, Average, Median) pairs.
The call uses the value 0.0 as a placeholder for the last two statistics. The lines in the boxplot
diagram have to be hidden explicitly by setting BoxPlotShowMedian and BoxPlotShowAverage to false.
Another alternative when creating a boxplot is to let the charting library
calculate the boxplot statistics automatically. To do that, the Chart.BoxPlot method
can be called with a collection of (xLabel, yValues) tuples as an argument. Each entry
is a label plus a set of observations. The statistics are automatically computed from the
values in the observations.
1: 2: 3: 4: 5: 6: 7: |
|
1: 2: 3: 4: |
|
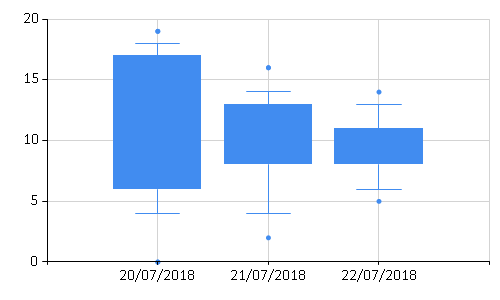
The example above demonstrates how to calculate boxplot diagrams
automatically from (randomly generated) data. It is also possible to set
several custom properties to configure the boxplot diagram. When
BoxPlotShowUnusualValues is true, the boxplot displays unusual values using points, as shown in Figure 1.
