FSharp.Charting: Library for Data Visualization
NOTE: FSharp.Charting is mostly used on Windows. See the XPlot package for alternative cross-platform charting.
The FSharp.Charting library implements charting suitable for use from F# scripting.
Once you load the library as documented in referencing the library document, you
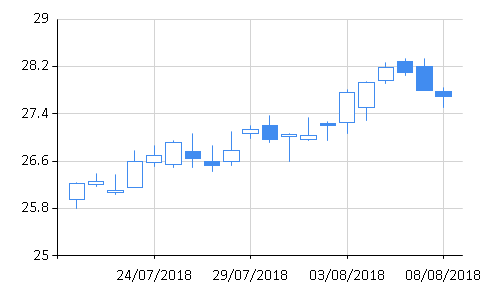
can use the members of the Chart type to easily build charts. The following example creates a candlestick
chart for a time series and sets the range of the Y axis:
1:
|
|
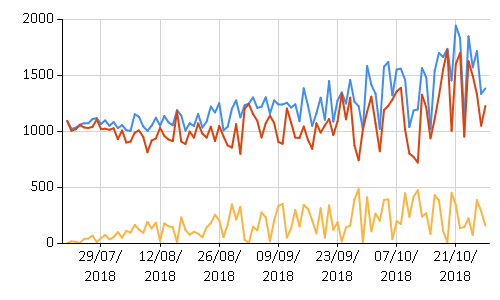
The library provides a composable API for creating charts. For example, you can use the
Chart.Combine function to create a chart consisting of multiple line charts. The following
example creates a single area showing sample income, expenses and profit in a single chart:
1: 2: 3: 4: |
|
How to get FSharp.Charting
- The FsLab template includes both FSharp.Charting and XPlot.
- The Windows version of the library is available as FSharp.Charting on NuGet
- There is a preliminary Mac/Linux version of the library is available as FSharp.Charting.Gtk on NuGet. See the XPlot package for alternative cross-platform charting.
FSharp.Charting features
- Cross-platform 2D charting and support for pseudo-3D charts on .NET.
- Many cross-platform chart types: Area, Bar, Bubble, Column, Line, Point and more.
- Create charts directly from FSharp.Data such as lists and tuples.
- Use either fluent or pipelined chart specifications.
- Create updating 'LiveChart' charts from F# or Rx observables.
- Can be used in conjunction with the FSharp.Data library.
- Many extra chart types (Windows-only): BoxPlot, Candlestick, Doughnut, ErrorBar, FastLine, FastPoint, Funnel, Kagi and more.
Approach, history and future
This library is a successor to FSharpChart. The last version of FSharpChart was version 0.61.
On Windows, FSharp.Charting is implemented using the Data Visualization charting controls available on Windows in .NET 4.x. On OSX, FSharp.Charting is implemented using the OxyPlot.GtkSharp charting library.
Contributing
The project is hosted on GitHub where you can report issues, fork the project and submit pull requests. If you're adding new public API, please also contribute examples that can be turned into a documentation.
If you want to discuss an issue or feature that you want to add the to the library, then you can submit an issue or feature request via Github.
For more information about the library architecture, organization and more see the contributing page.
- The documentation is automatically generated from
*.fsxfiles in thedocs/contentfolder. If you find a typo, please submit a pull request!
Library license
The library is available under the MIT licence. For more information see the License file in the GitHub repository. In summary, this means that you can use the library for commercial purposes, fork it, modify it as you wish.
