Correlation network
Summary: This tutorial demonstrates an example workflow using different FsLab libraries. The aim is to create a correlation network, finding a threshold for which to filter and visualizing the result.
Introduction
Networks provide a mathematical representation of connections found everywhere, e.g. computers connected through the internet, friends connected by friendships or animals connected in the food web. This mathematical representation allows for many different, but universal approaches for creating, manipulating and interrogating these networks for new information. E.g. the most important nodes (or vertices) can be identified for different metrics or the most efficient connection between two nodes can be found.
One widely used kind of network in biology is the gene co-expression network. Here the nodes are genes and the edges (or links) between them are how similar their expression patterns are. One measure for this similarity is the correlation between the expression patterns. This kind of network is often used for finding interesting candidates, by identifying genes which are highly connected with known genes of interest.
In this tutorial, a simple workflow will be presented for how to create and visualize a correlation network from experimental gene expression data. For this, 4 FsLab libraries will be used:
- FSharp.Data for retreiving the data file
- Deedle for reading a frame containing the data
- & 3. FSharp.Stats to calculate correlations and finding a critical threshold
- Cytoscape.NET to visualize the results
Referencing packages
#r "nuget: FSharp.Data, 6.3.0"
#r "nuget: Deedle, 3.0.0"
#r "nuget: FSharp.Stats, 0.5.0"
#r "nuget: Cytoscape.NET.Interactive, 0.2.0"
#r "nuget: Plotly.NET.Interactive, 4.1.0"
// The edge filtering method presented in this tutorial requires an Eigenvalue decomposition.
// FSharp.Stats uses the one implemented in the LAPACK library.
// To enable it just reference the lapack folder in the FSharp.Stats nuget package:
//FSharp.Stats.ServiceLocator.setEnvironmentPathVariable @"C:\Users\bvenn\.nuget\packages\fsharp.stats\0.5.0\netlib_LAPACK" //
FSharp.Stats.ServiceLocator.setEnvironmentPathVariable @"C:\Users\USERNAME\.nuget\packages\fsharp.stats\0.5.0\netlib_LAPACK" //
FSharp.Stats.Algebra.LinearAlgebra.Service()
- Cytoscape.NET.Interactive, 0.2.0
- Deedle, 3.0.0
- FSharp.Data, 6.3.0
- FSharp.Stats, 0.5.0
- Plotly.NET.Interactive, 4.1.0
Loading extensions from `C:\Users\bvenn\.nuget\packages\cytoscape.net.interactive\0.2.0\interactive-extensions\dotnet\Cytoscape.NET.Interactive.dll`
Loading extensions from `C:\Users\bvenn\.nuget\packages\plotly.net.interactive\4.1.0\interactive-extensions\dotnet\Plotly.NET.Interactive.dll`
FSharp.Stats.LinearAlgebraLAPACK
Loading Data
In this tutorial, an multi experiment ecoli gene expression dataset is used.
FSharp.Data and Deedle are used to load the data into the fsi.
open FSharp.Data
open Deedle
// Load the data
let rawData = Http.RequestString @"https://raw.githubusercontent.com/HLWeil/datasets/main/data/ecoliGeneExpression.tsv"
// Create a deedle frame and index the rows with the values of the "Key" column.
let rawFrame : Frame<string,string> =
Frame.ReadCsvString(rawData, separators = "\t")
|> Frame.take 500
|> Frame.indexRows "Key"
rawFrame.RowCount,rawFrame.ColumnCount
(500, 100)
| Item1 | 500 |
| Item2 | 100 |
Create a correlation network
Networks can be represented in many different ways. One representation which is computationally efficient in many approaches is the adjacency matrix. Here every node is represented by an index and the strength of the connection between nodes is the value in the matrix at the position of their indices.
In our case, the nodes of our network are genes in Escherichia coli (a well studied bacterium). In a correlation network, the strength of this connection is the correlation. The correlation between these genes is calculated over the expression of these genes over different experiments. For this we use the pearson correlation.
open FSharp.Stats
open Plotly.NET
// Get the rows as a matrix
let rows =
rawFrame
|> Frame.toJaggedArray
|> Matrix.ofJaggedArray
// Create a correlation network by computing the pearson correlation between every tow rows
let correlationNetwork =
Correlation.Matrix.rowWisePearson rows
// Histogram over the correlations for visualizing the distribution
let correlationHistogram =
correlationNetwork
|> Matrix.toJaggedArray
|> Array.mapi (fun i a -> a |> Array.indexed |> Array.choose (fun (j,v) -> if i = j then None else Some v))
|> Array.concat
|> Chart.Histogram
|> Chart.withXAxisStyle "pearson correlation coefficients"
|> Chart.withYAxisStyle "occurrence count"
correlationHistogram
As can be seen, the correlation between the most genes is relatively weak. The correlations roughly follow a right skewed gaussian distribution. So in this dataset genes tend to be more likely to be correlated than anti-correlated.
Critical threshold finding
Creating this correlation network is not the endproduct you want though, as everything is still connected with everything. Many useful algorithms, like module finding, can only distinguish between whether an edge between two vertices exists or not, instead of taking into consideration the strength of the connection. Therefore, many questions you want the network to answer, require a selection step, in which strong connections are kept and weak ones are discarded. This is called thresholding. For this different algorithms exist. Here we will use an algorithm based on Random Matrix Theory (RMT).
The basic idea behind this RMT approach is filtering the network until a modular state is reached. Modularity is a measure for how much nodes in a network form groups, where connections between same-group members is stronger or more likely than between members of different groups. In general, biological networks are generally regarded as modular, as usually more simple parts (like proteins resulting from gene expression) need to work closely together to form more complex functions (like photosynthesis).
//System.IO.File.ReadAllText "../../images/RMT_detailedC.html"
//|> DisplayFunctions.HTML

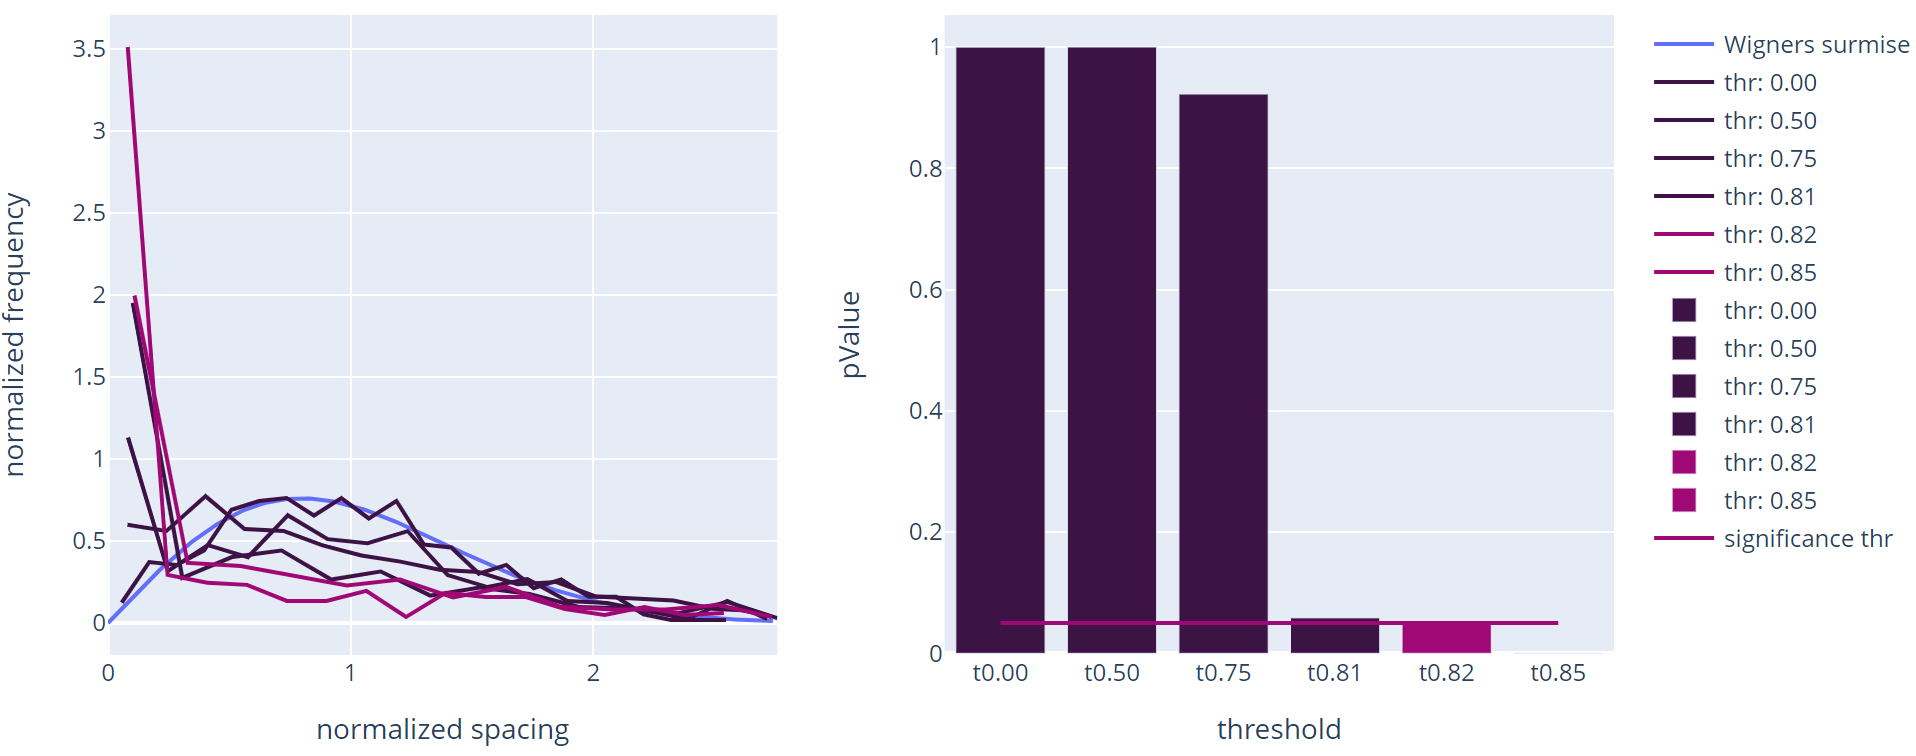
Finding this threshold is a repetitive process shown above. For each threshold, the eigenvalues of the matrix are calculated, normalized and the spacing between these eigenvalues is calculated. For an evenly filled matrix, the frequency of these spacings follows the Wigner's surmise (see left picture above). If a certain number of edges is filtered and an underlying modular structure is revealed, the spacings start following the Poisson distribution. The algorithm searches the point where this switch from one distribution to the other is reached with a given accuracy (see right picture above).
// Calculate the critical threshold with an accuracy of 0.01
// due to long operation time the threshold is precomputed
let threshold() =
Testing.RMT.compute 0.9 0.01 0.05 correlationNetwork
let thr = 0.8203125
// Set all correlations less strong than the critical threshold to 0
let filteredNetwork =
correlationNetwork
|> Matrix.map (fun v -> if (abs v) > thr then v else 0.)
// Histogram over the correlations for visualizing the distribution
let correlationHistogramFiltered =
filteredNetwork
|> Matrix.toJaggedArray
|> Array.mapi (fun i a -> a |> Array.indexed |> Array.choose (fun (j,v) -> if i = j || v = 0. then None else Some v))
|> Array.collect id
|> Chart.Histogram
|> Chart.withXAxisStyle "filtered pearson correlation coefficients"
|> Chart.withYAxisStyle "occurrence count"
correlationHistogramFiltered
After filtering the edges according the critical threshold found using RMT, only the strongly correlated genes are regarded as linked. As the distribution of all correlations was slightly skewed to higher values, only few anti correlations meet the threshold.
Data visualization
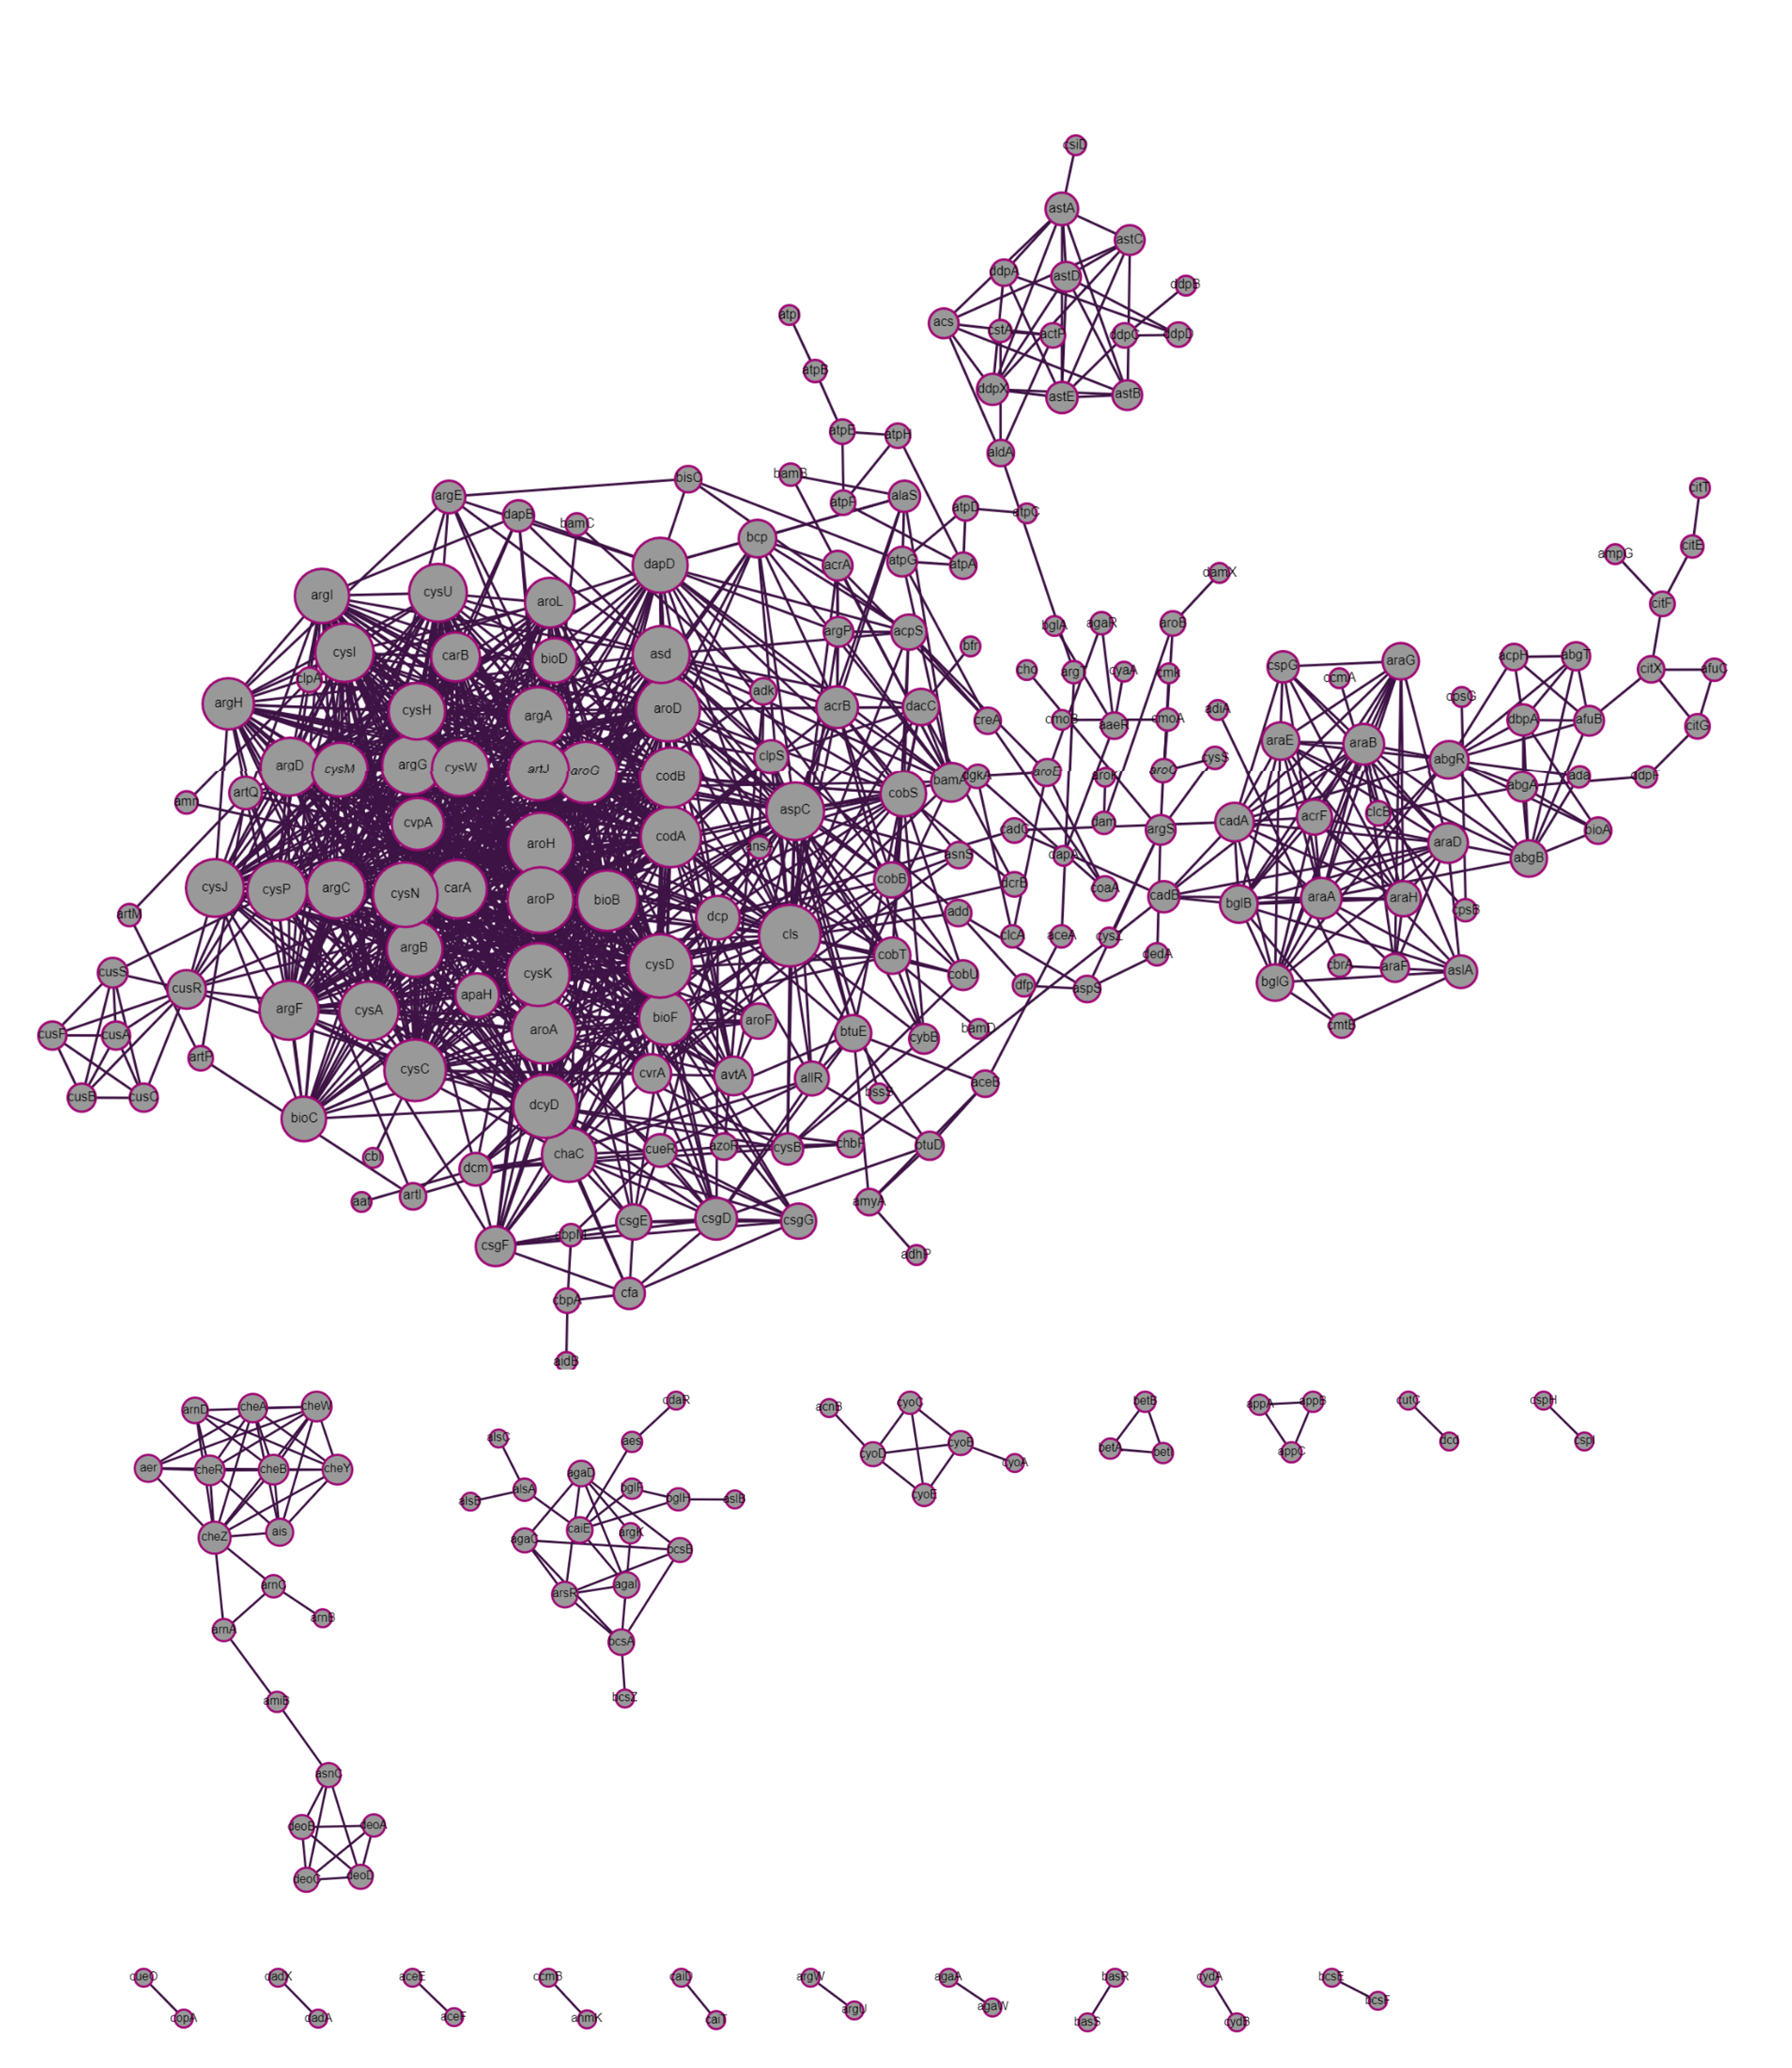
Finally, the resulting network can be visualized. For this we use Cytoscape.NET, an FsLab library which makes use of the Cytoscape.js network visualization tool.
Further information about styling the graphs can be found here.
open Cytoscape.NET
// The styled vertices. The size is based on the degree of this vertex, so that more heavily connected nodes are emphasized
let cytoVertices =
rawFrame.RowKeys
|> Seq.toList
|> List.indexed
|> List.choose (fun (i,v) ->
let degree =
Matrix.getRow filteredNetwork i
|> Seq.filter ((<>) 0.)
|> Seq.length
let styling = [CyParam.label v; CyParam.weight (sqrt (float degree) + 1. |> (*) 10.)]
if degree > 1 then
Some (Elements.node (string i) styling)
else
None
)
// Styled edges
let cytoEdges =
let len = filteredNetwork.Dimensions |> fst
[
for i = 0 to len - 1 do
for j = i + 1 to len - 1 do
let v = filteredNetwork.[i,j]
if v <> 0. then yield i,j,v
]
|> List.mapi (fun i (v1,v2,weight) ->
let styling = [CyParam.weight (0.2 * weight)]
Elements.edge ("e" + string i) (string v1) (string v2) styling
)
// Resulting cytograph
let cytoGraph =
CyGraph.initEmpty ()
|> CyGraph.withElements cytoVertices
|> CyGraph.withElements cytoEdges
|> CyGraph.withStyle "node"
[
CyParam.shape "circle"
CyParam.content =. CyParam.label
CyParam.width =. CyParam.weight
CyParam.height =. CyParam.weight
CyParam.Text.Align.center
CyParam.Border.color "#A00975"
CyParam.Border.width 3
]
|> CyGraph.withStyle "edge"
[
CyParam.Line.color "#3D1244"
]
|> CyGraph.withLayout (Layout.initCose (Layout.LayoutOptions.Cose(NodeOverlap = 400,ComponentSpacing = 100)))
