FSharp.Charting: Point and Line Charts
Summary: This example shows how to create line and point charts in F#.
A line or a point chart can be created using the Chart.Line and Chart.Point methods. When generating a
very large number of points or lines, it is better to use Chart.FastLine and Chart.FastPoint. These are special types
of charts that do not support as many visual features but are more efficient.
When using F# Interactive, each of these examples needs to be evaluated separately. This way, F# Interactive invokes a handler that automatically shows the created chart.
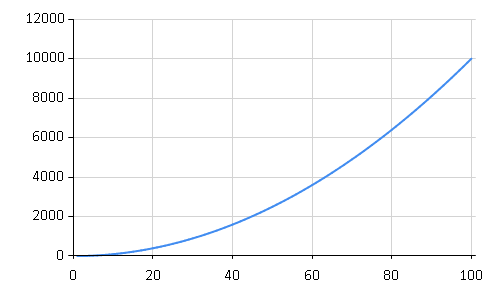
A Simple Line Chart
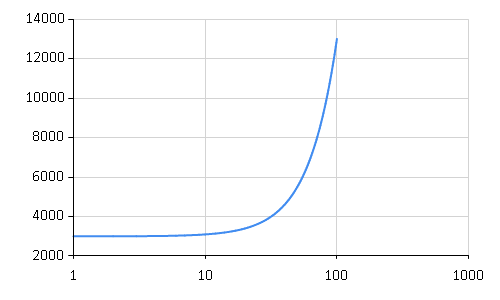
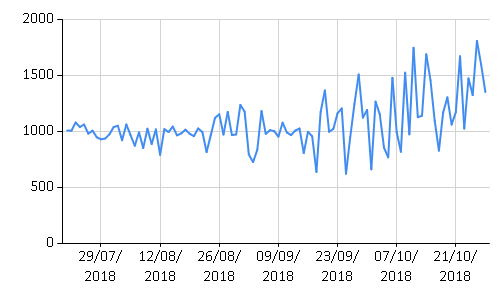
The following example calls the Chart.Line method with a list of X and Y values as tuples. The snippet generates
values of a simple function, f(x)=x^2. The values of the function are generated for X ranging from 1 to 100. The chart generated is
shown below.
1: 2: 3: 4: 5: 6: |
|
1: 2: |
|
Pipelining into Chart.Line
The following example generates a list containing both X and Y values.
1: 2: 3: |
|
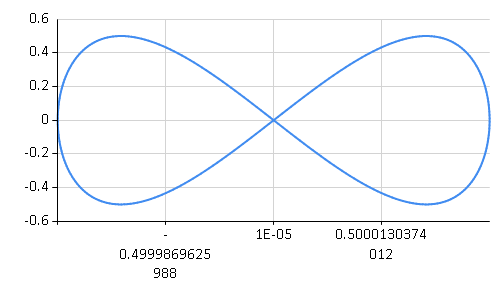
Specifying only Y values
The following example below shows that you may also simply give a set of Y values, rather than (X,Y) value pairs.
1: 2: |
|
It uses a sequence expression ranging
from 0 to 2π with a step size 0.02. This produces a large number of points, so the snippet uses the Chart.Line
method to draw the chart. When using a single list as the data source, it is also possible to elegantly use the pipelining (|> operator).
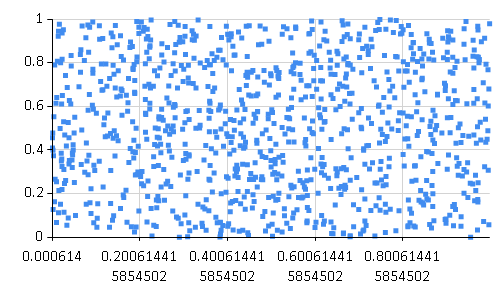
A Point Chart
The following example shows how to generate a scatter plot. It uses a list to specify the X and Y coordinates of the points.
1: 2: 3: 4: |
|
1:
|
|
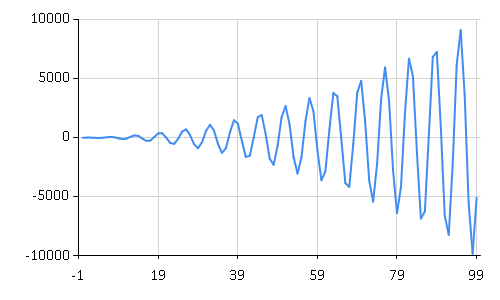
Specifying Minimums, Maximums and other properties on a Line Chart
The following example shows how to set the name and Y axis minimum properties on the chart and use log-distribution for the X axis.
1: 2: |
|
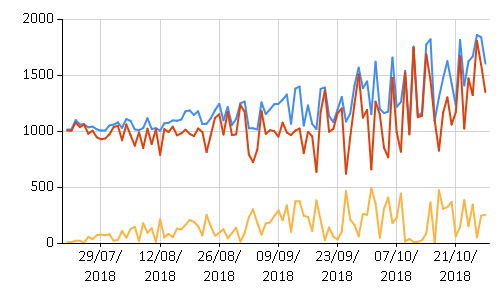
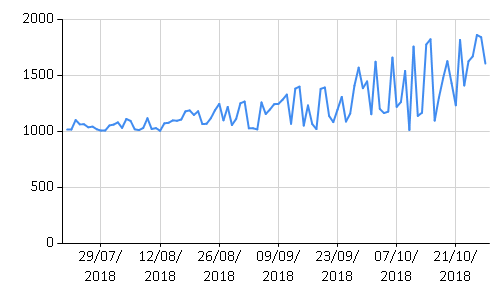
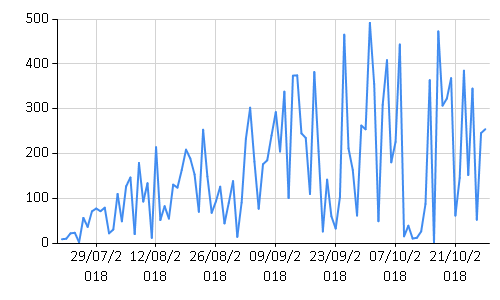
Combining Line Charts
The following example shows how to combine several line charts and give each data set a name. A legend is added automatically when names are used for data sets.
1: 2: 3: 4: 5: 6: 7: 8: 9: 10: 11: |
|
1:
|
|
1:
|
|
1:
|
|
1: 2: 3: 4: |
|